 11
11
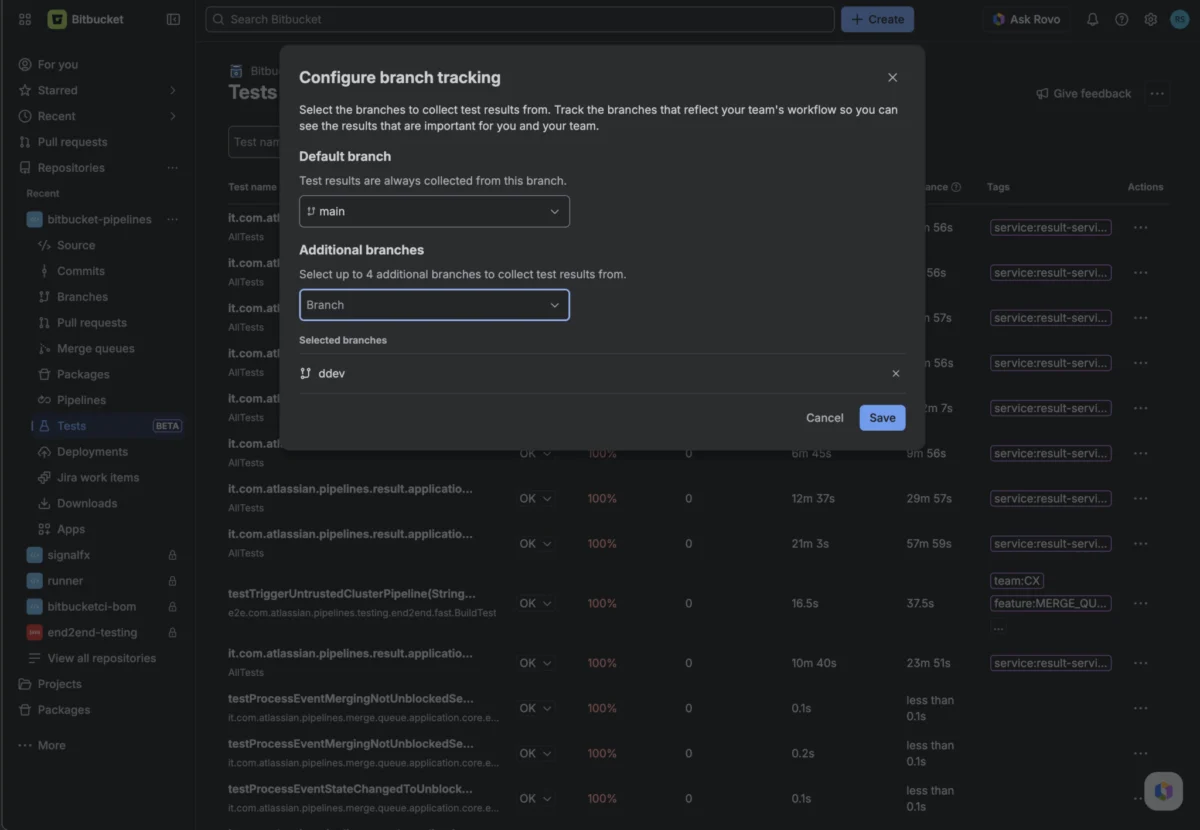
Atlassian has officially announced a significant update to Bitbucket Tests, introducing the ability to track test results across multiple non-default branches. This feature, which was among the most requested capabilities during the Bitbucket Tests beta period, marks a shift in how the platform handles continuous integration and visibility for software development teams. By moving beyond the limitation of only tracking the default branch—typically "main"—Bitbucket now allows teams to monitor the health of their test suites across the various branches that constitute a modern delivery pipeline.
For years, the standard operating procedure for many development teams has involved complex branching strategies. While the "main" branch often represents the production-ready state of a codebase, the actual work of integration, stabilization, and release preparation occurs elsewhere. Integration frequently happens on a "develop" branch, stabilization and user acceptance testing occur on "staging," and final release candidates are often cut from dedicated "release" branches. Until this latest update, Bitbucket Tests only tracked test data from the default branch. This created a visibility gap where the branches most critical to the active development and stabilization phases remained invisible within the specialized "Tests" view of the Bitbucket interface.
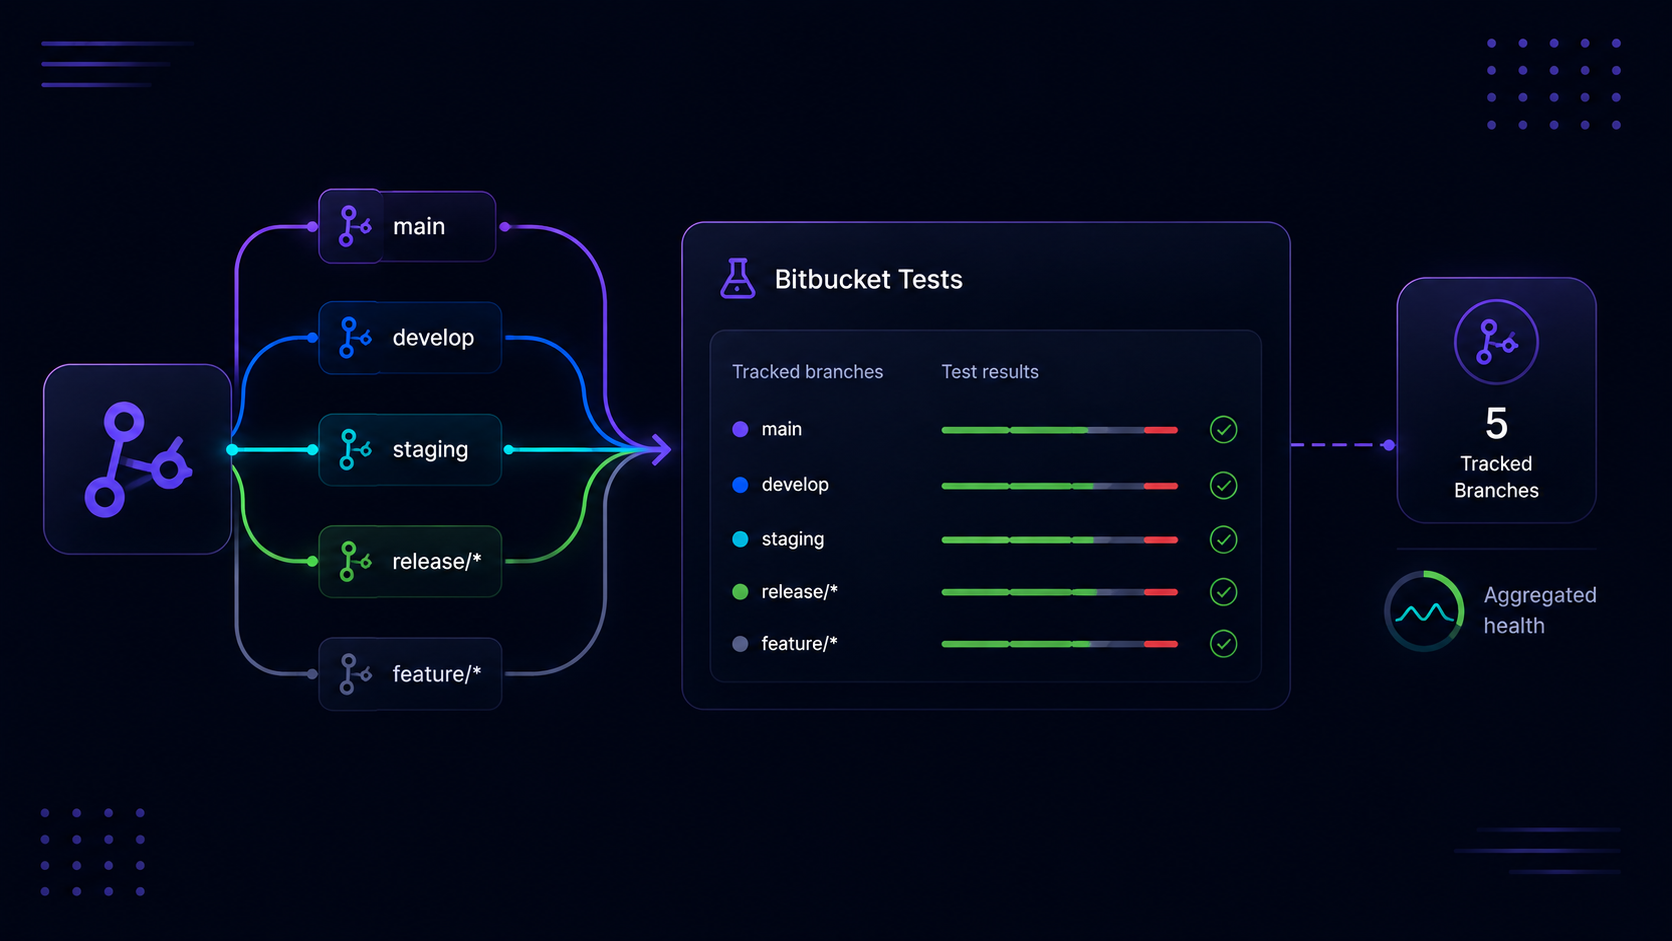
The introduction of multiple branch tracking directly addresses this discrepancy. Bitbucket Tests now supports the tracking of up to five branches per repository. This count includes the default branch, meaning teams can select four additional branches—such as develop, staging, and specific release or feature branches—to monitor consistently. By expanding this scope, Bitbucket ensures that key performance indicators, such as failure rates, flaky test scores, and comprehensive test histories, reflect the actual workflows used by engineering organizations rather than an idealized version centered solely on the production branch.
This update is available to users on Bitbucket Cloud’s Standard and Premium plans. It serves as a core enhancement to the Bitbucket Pipelines ecosystem, providing a more granular look at how code quality evolves as it moves through the software development life cycle (SDLC). The ability to track these metrics across different environments allows teams to catch regressions and identify intermittent "flaky" tests before they ever reach the main codebase, thereby protecting the integrity of the production environment.
The importance of this feature lies in the data-driven insights it provides to repository administrators and developers. In a standard CI/CD workflow, a test failure on a feature branch is expected, but a high failure rate on a "staging" branch is a signal of a systemic issue that requires immediate attention. Previously, if a team wanted to analyze the stability of their staging branch over time, they would have to manually parse pipeline logs or use external tools. With multiple branch tracking, these insights are integrated directly into the Bitbucket UI. The "flaky score," a metric that identifies tests that pass and fail inconsistently without code changes, becomes significantly more useful when applied to long-lived integration branches where code is frequently merged.
To begin utilizing these new capabilities, Atlassian has outlined a specific technical workflow for repository administrators. The first prerequisite is ensuring that the test frameworks utilized within Bitbucket Pipelines are configured to generate JUnit-XML compatible test reports. JUnit-XML has become the industry standard for test reporting, and most modern testing frameworks—including those for Java, Python, JavaScript, and Go—support this format either natively or through widely available plugins. Without these compatible reports, the Bitbucket platform cannot parse the results to populate the "Tests" dashboard.
Once the pipeline is correctly generating reports, repository admins can access the configuration settings via the "Tests" tab in the Bitbucket sidebar. A new option, "Configure branch tracking," allows administrators to manage which branches are monitored. From this interface, users can search for and add the specific branches that are most relevant to their team’s delivery process. Once a branch is added to the tracking list, Bitbucket begins aggregating data from the very next pipeline run associated with that branch.
The visual representation of this data is split into two primary views within the Bitbucket interface. On one side, users are presented with a summary of test results, which provides high-level metrics such as the total number of tests run, the percentage of passing tests, and the identified flaky tests over a set period. On the other side, the interface provides a detailed view of single test executions. This allows developers to drill down into specific test cases to see their historical performance on a particular branch, helping to distinguish between a one-time failure caused by a specific code change and a recurring issue caused by environmental factors or poorly written test logic.
The decision to limit tracking to five branches per repository is a strategic one, designed to cover the most common branching models, such as Gitflow or Trunk-Based Development with short-lived release branches. For most teams, tracking "main," "develop," "staging," and the two most recent "release" branches provides a complete picture of the path to production. This focus prevents the "Tests" dashboard from becoming cluttered with data from hundreds of short-lived feature branches, while still providing deep visibility into the branches that represent the core stages of the deployment pipeline.
Atlassian’s move to include this feature in both the Standard and Premium tiers highlights a commitment to making high-level DevOps metrics accessible to a broader range of teams. As organizations scale, the cost of "flaky" tests—those that fail intermittently for reasons unrelated to code changes—can become a major bottleneck. Flaky tests slow down development cycles, erode trust in the CI/CD pipeline, and can lead to developers ignoring genuine failures. By providing branch-specific flaky scores, Bitbucket allows teams to isolate and fix these problematic tests in the branches where they first appear, such as "develop," rather than allowing them to migrate into the "main" branch where they could block critical hotfixes or production deployments.
The technical documentation provided by Atlassian emphasizes that this is a "live" feature, meaning that as soon as the configuration is saved, the system is ready to ingest data. There is no need to re-run historical pipelines; the tracking starts with the subsequent execution of the pipeline on the newly tracked branch. This ensures that the data remains current and reflects the most recent state of the code.
The development of multiple branch tracking was heavily influenced by the Atlassian community. During the beta phase of Bitbucket Tests, the inability to track non-default branches was identified as a primary pain point for enterprise customers and high-velocity development teams. The feedback indicated that for many users, the "main" branch was the least active branch in terms of daily testing, as most of the heavy lifting occurred in integration branches. By responding to this feedback, Atlassian aims to strengthen Bitbucket’s position as a comprehensive DevOps platform that integrates seamlessly with the way modern developers actually work.
Looking forward, Atlassian has signaled that this is not the final iteration of the "Tests" feature. The company continues to solicit feedback through its community threads and support channels to determine how to further refine the test reporting experience. Potential areas for future growth could include deeper integration with Jira for automated ticket creation based on test failures or expanded support for different types of reporting formats beyond JUnit-XML. However, the current release focuses on the immediate need for multi-branch visibility.
In summary, the addition of multiple branch tracking to Bitbucket Tests represents a maturing of Atlassian’s CI/CD offering. It acknowledges the complexity of modern software delivery and provides the tools necessary for teams to maintain high standards of code quality across their entire workflow. By allowing up to five branches to be tracked simultaneously, Bitbucket provides a clear, data-driven view of repository health, helping teams to reduce failure rates, eliminate flakiness, and deliver software with greater confidence. Users are encouraged to review their current pipeline configurations and administrative settings to take full advantage of these new insights across their develop, staging, and release branches.