 11


Bitcoin (BTC) has achieved its first weekly close above the significant $80,000 mark since early May, a development occurring as market participants closely monitor the evolving US inflation outlook. This resurgence in Bitcoin’s price coincides with a period of heightened economic scrutiny, including upcoming key inflation data releases and significant currency interventions by Japan.
US inflation data is once again taking center stage this week, following a surprising employment report that previously exerted pressure on cryptocurrency and other risk-sensitive assets. The August figures for the Producer Price Index (PPI) and Consumer Price Index (CPI) are scheduled for release on Thursday and Friday, respectively. In the preceding month, the CPI had aligned with market expectations, registering a 0.1% increase month-on-month and a 3.4% rise year-on-year. This followed a trend of softer-than-anticipated June results. Despite these figures presenting a seemingly positive picture for inflation control, Kevin Warsh, a former Chair of the US Federal Reserve, emphasized that these data points alone do not provide sufficient grounds for a reassessment of financial policy. Speaking at the Jackson Hole economic symposium in late August, Warsh noted that while broad inflation measures have significantly declined from their peaks, progress over the past couple of years has been more modest. He indicated that the summer’s Personal Consumption Expenditures (PCE) and CPI readings, while better than expected, did not signify a meaningful improvement in underlying inflation trends.
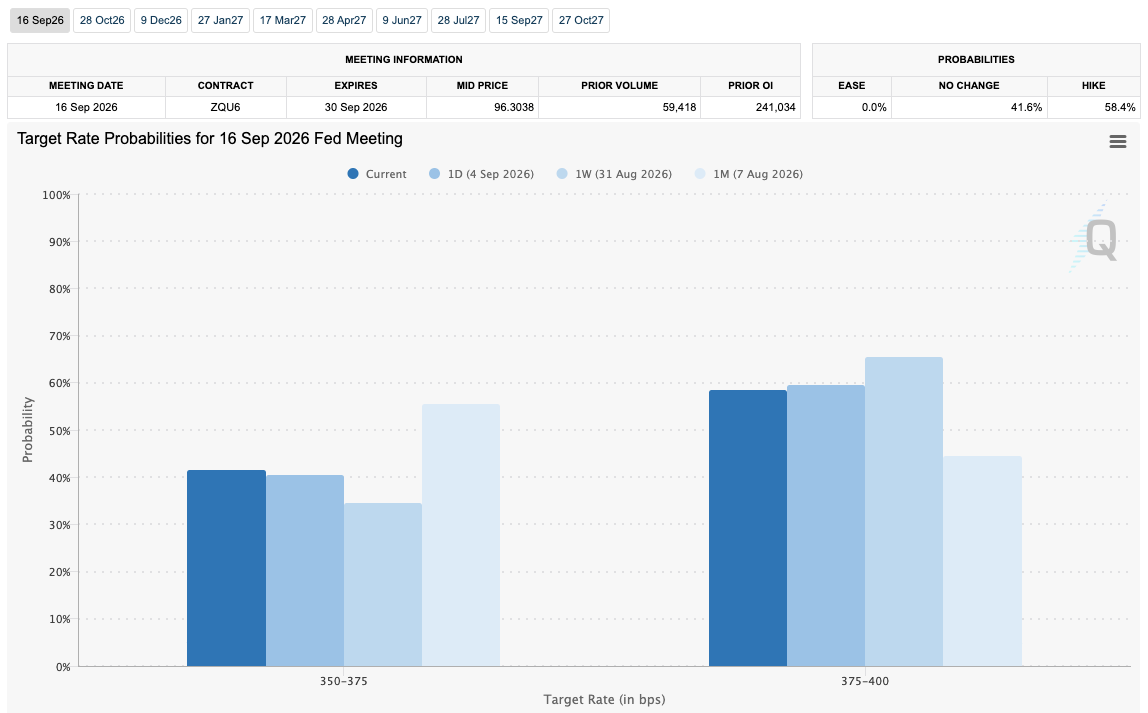
In response to these economic signals and commentary, financial markets have increased the probability of further Federal Reserve rate hikes at its upcoming meeting on September 16th. Data from CME Group’s FedWatch Tool indicates that the consensus now favors a 0.25% rate increase, with the odds standing at 58.4%. These concerns about potential rate hikes were further amplified by last week’s nonfarm payrolls data, which significantly exceeded expectations and included upward revisions to prior figures. The US economy added 162,000 jobs in August, a stark contrast to the prior estimate of 56,000. A robust labor market typically reduces the urgency for the Federal Reserve to loosen monetary policy, thereby solidifying the possibility of further rate hikes, particularly with core inflation remaining above the Fed’s 2% target. Despite these market dynamics, Fed Governor Christopher Waller has voiced support for a pause in rate hikes, and US President Donald Trump has continued to advocate for rate cuts by the Federal Reserve. Trump expressed his view that high interest rates place the US at a significant disadvantage. Both the PPI and CPI reports are anticipated to influence the market outlook prior to the Federal Reserve’s meeting, with crypto market volatility historically exhibiting sensitivity to inflation data releases.
Trading resource Mosaic Asset Company offered a nuanced perspective, suggesting that the strong jobs report might still present a silver lining for equity markets. While the immediate focus is on the interest rate outlook, the firm noted that positive economic news could translate into improved corporate earnings, potentially supporting a bull market. However, Mosaic also cautioned about seasonal factors, pointing out that September is traditionally the worst-performing month for equities, and the upcoming US midterm elections in November are expected to contribute to increased volatility in the fourth quarter.
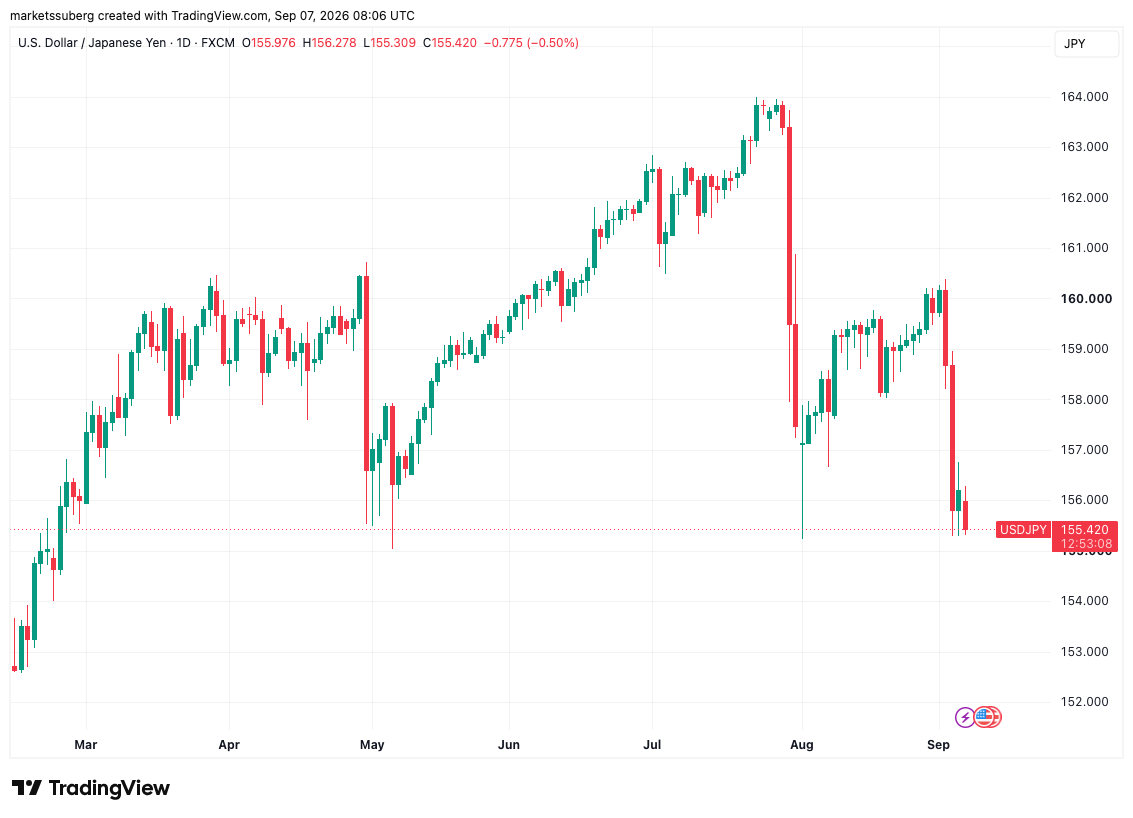
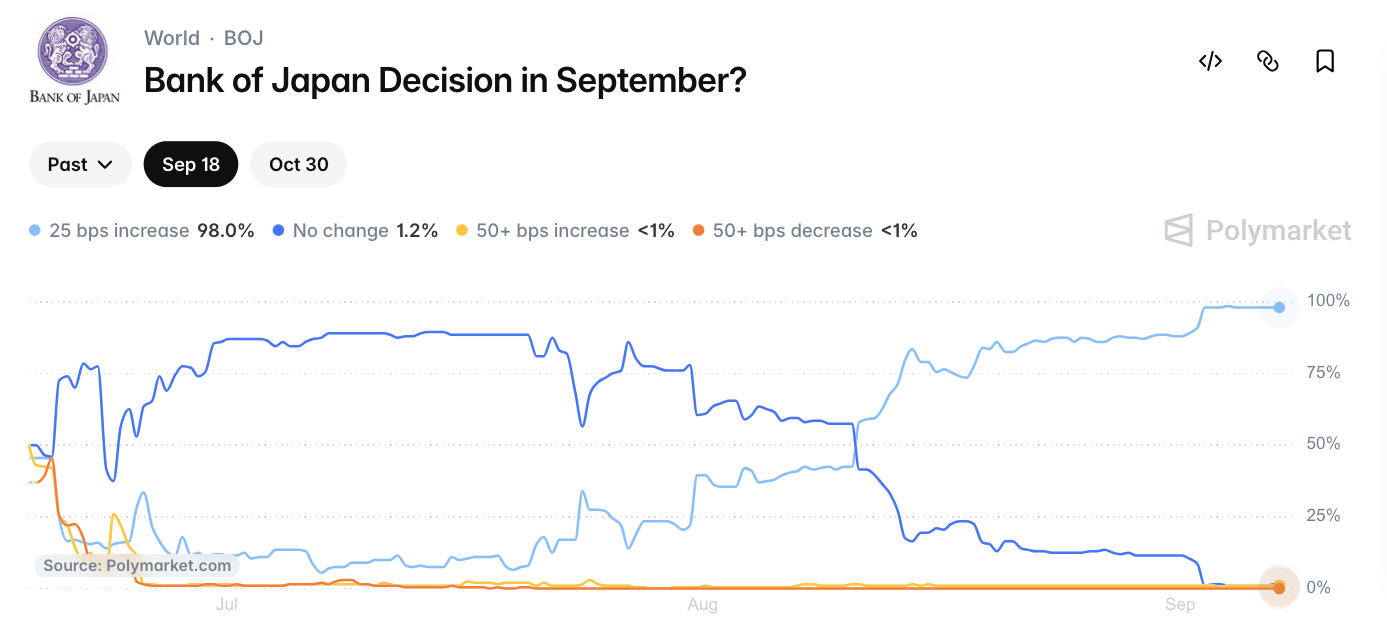
Meanwhile, traders are closely observing the Japanese yen, as new government data reveals the scale of record currency interventions undertaken by Japan. On Monday, Japan’s Ministry of Finance reported a substantial decrease of $79.57 billion in its foreign reserves from the end of July, attributed to a record currency intervention aimed at strengthening the yen. This intervention saw the Japanese currency strengthen to approximately 155 against the US dollar, a level it maintained during Monday’s Asia trading session. Atsushi Takeda, chief economist at Itochu Research Institute, suggested that Japan likely utilized foreign securities and deposits, with a strong probability that US Treasuries were sold to fund these interventions. This significant selling of US Treasuries could have implications beyond the yen, particularly as US bond yields are already under pressure. The Treasury Department has announced contingency measures to address this, set to commence on September 9th. The potential for Japan to sell US Treasuries to fund future interventions might elicit a negative response from Washington, potentially complicating the Bank of Japan’s (BOJ) ability to act should yen weakness re-emerge. Akari Nishimura, an economist at the Japan Research Institute, noted that such a scenario would make it challenging for the ministry and the Bank of Japan to implement future policies. Traders are now pricing in a potential interest rate hike by the BOJ in September, with benchmark rates already at their highest since 1995. Data from Polymarket indicates a high probability, around 98%, of a 0.25% increase. The cryptocurrency markets remain highly sensitive to movements in the USD/JPY pair and associated news due to the potential long-term impact on the yen carry trade and broader liquidity trends.
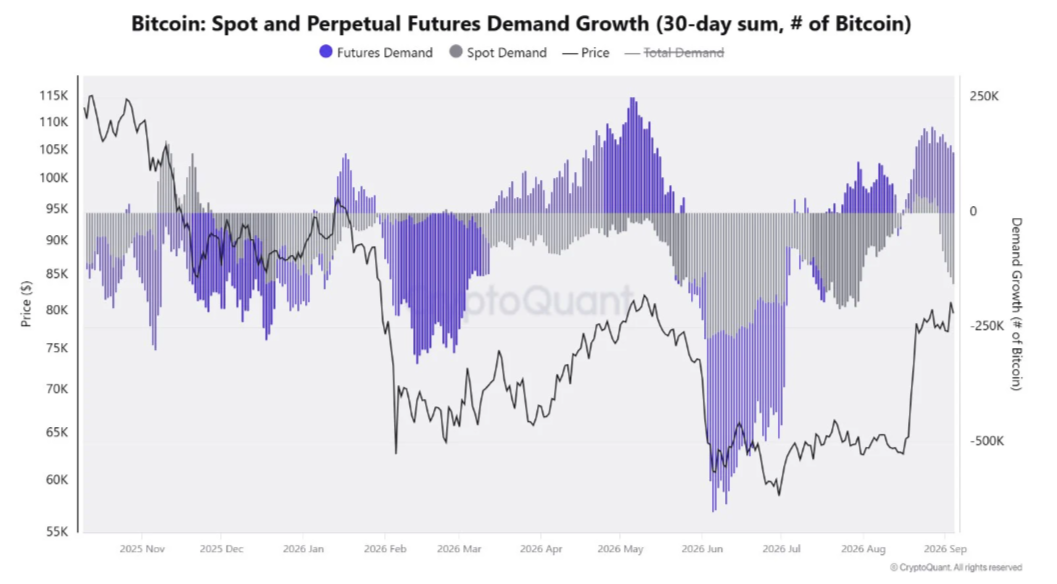
Despite these global economic shifts, Bitcoin’s spot market activity is showing signs of lagging. Analysis from onchain analytics platform CryptoQuant suggests that Bitcoin requires increased spot market participation to break out of its current low-timeframe range, which is centered around the $80,000 level. The recent upside volatility in Bitcoin’s price was accompanied by sharp increases in open interest on derivatives exchanges, indicating that derivatives traders are largely driving short-term price movements. CryptoQuant observed that Bitcoin’s realized cap, which represents the aggregate value of the BTC supply at the price it last moved onchain, has not kept pace with the expansion in open interest. This suggests that the current rally is more heavily influenced by futures trading than by on-chain capital. Previously, CoinTelegraph reported that a lack of spot demand has been a significant impediment to a sustained change in Bitcoin’s price trend, with profit-taking surging as BTC/USD returned investors to net profit last month. CryptoQuant warns that spot demand continues to exhibit a negative trend, diverging from futures demand on a 30-day rolling basis, which is seen as an unfavorable signal for a sustained bullish rally.
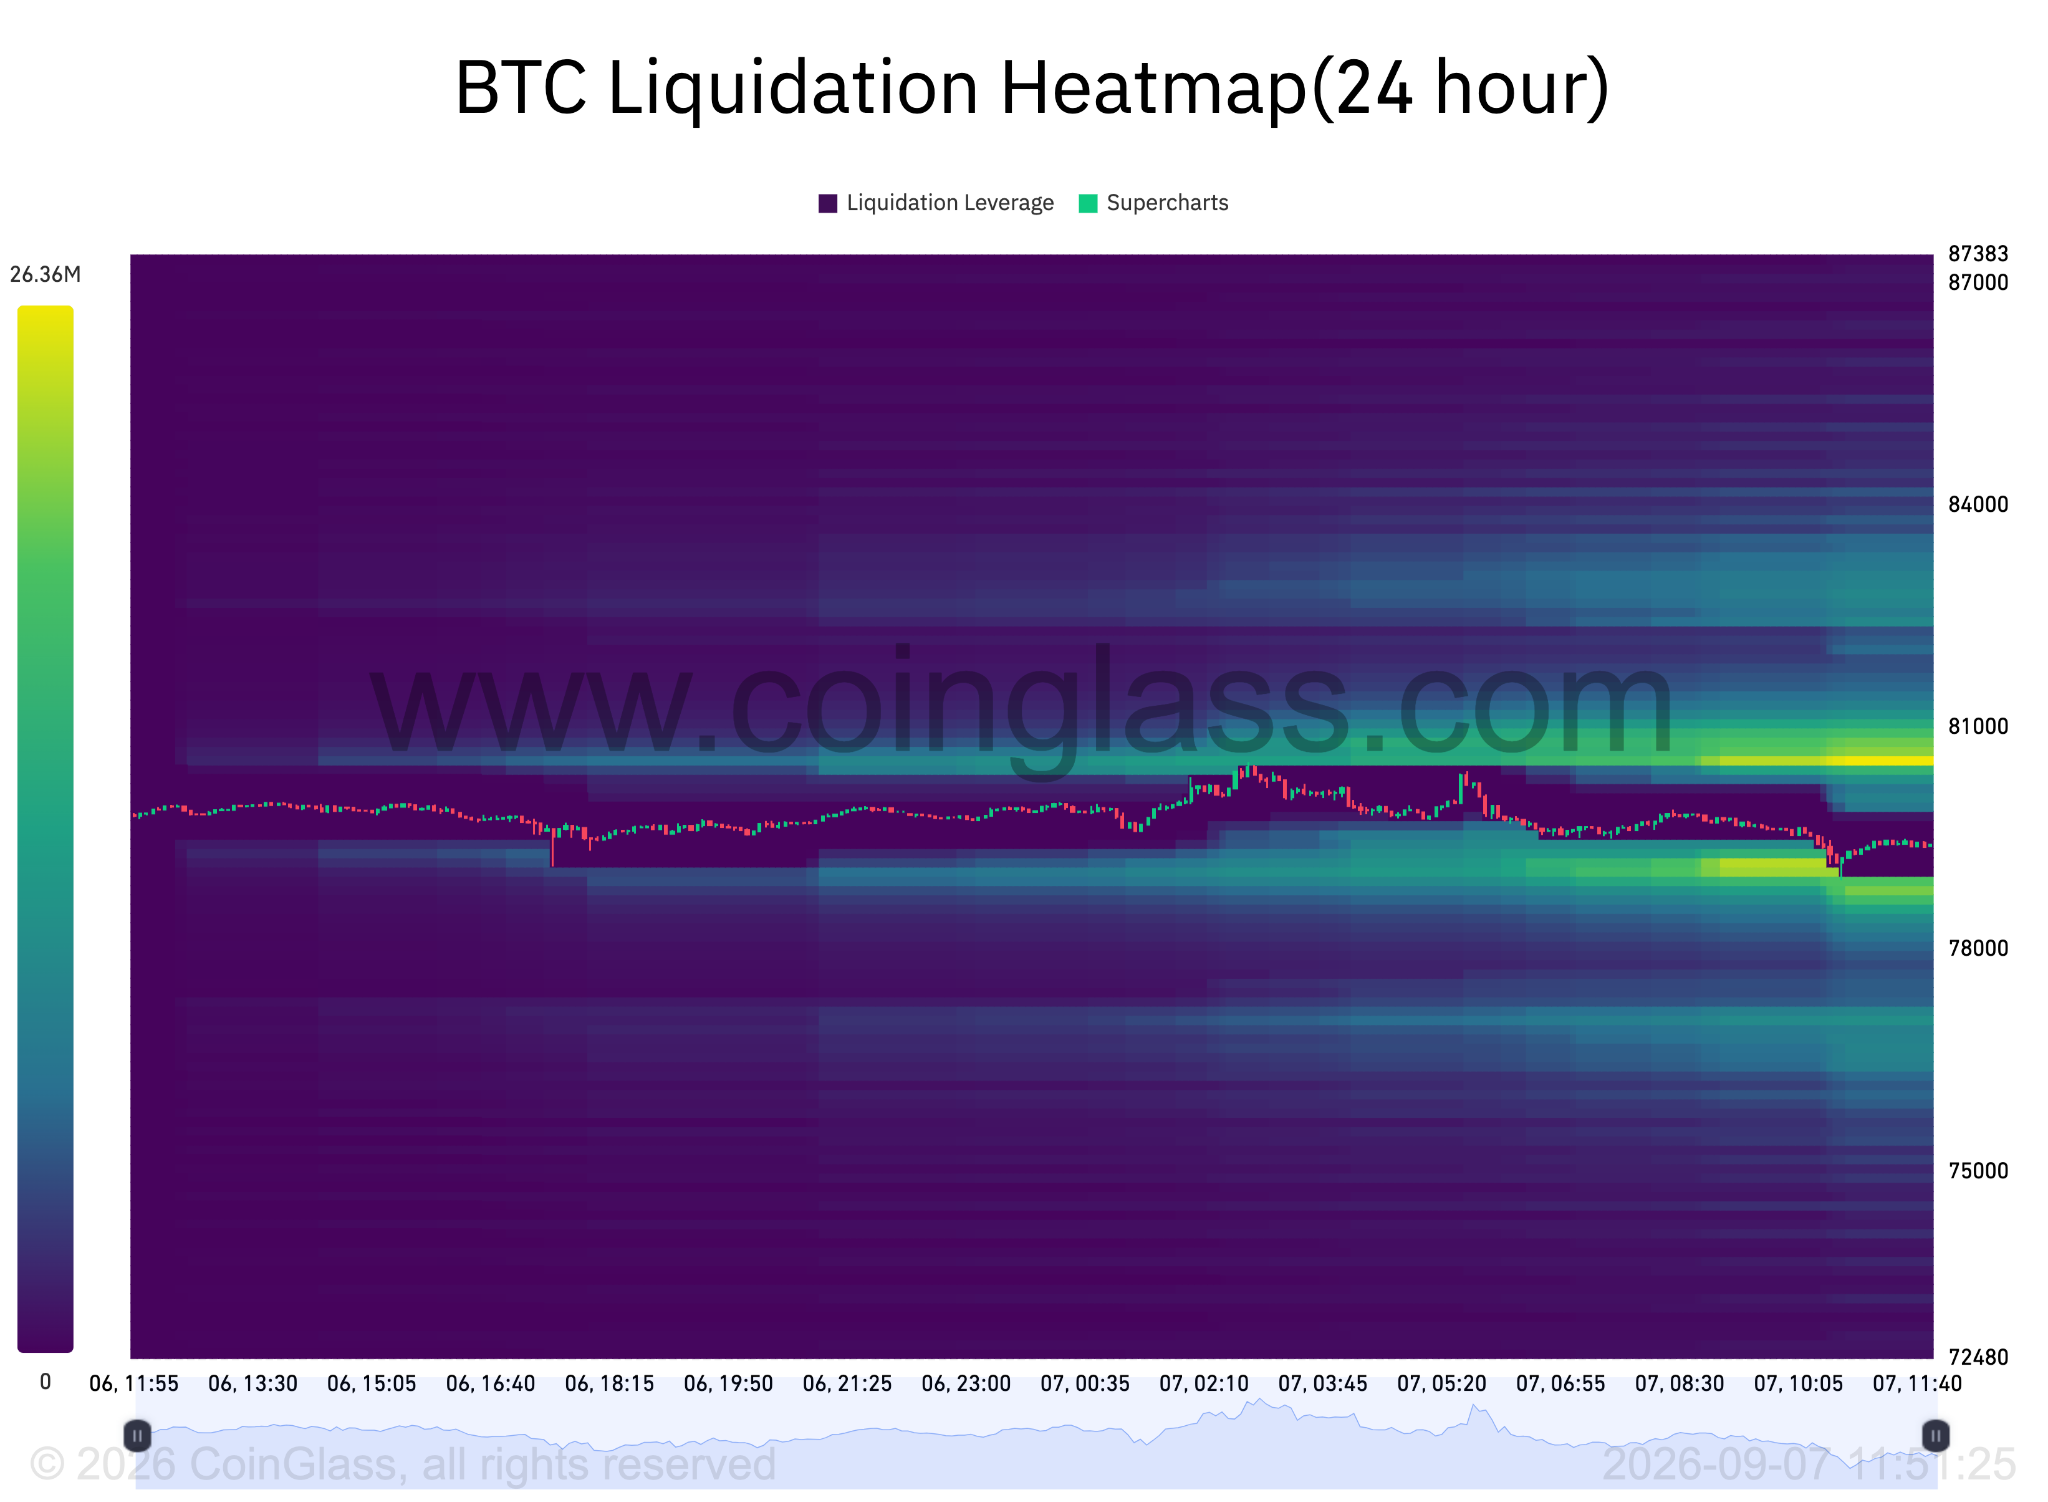
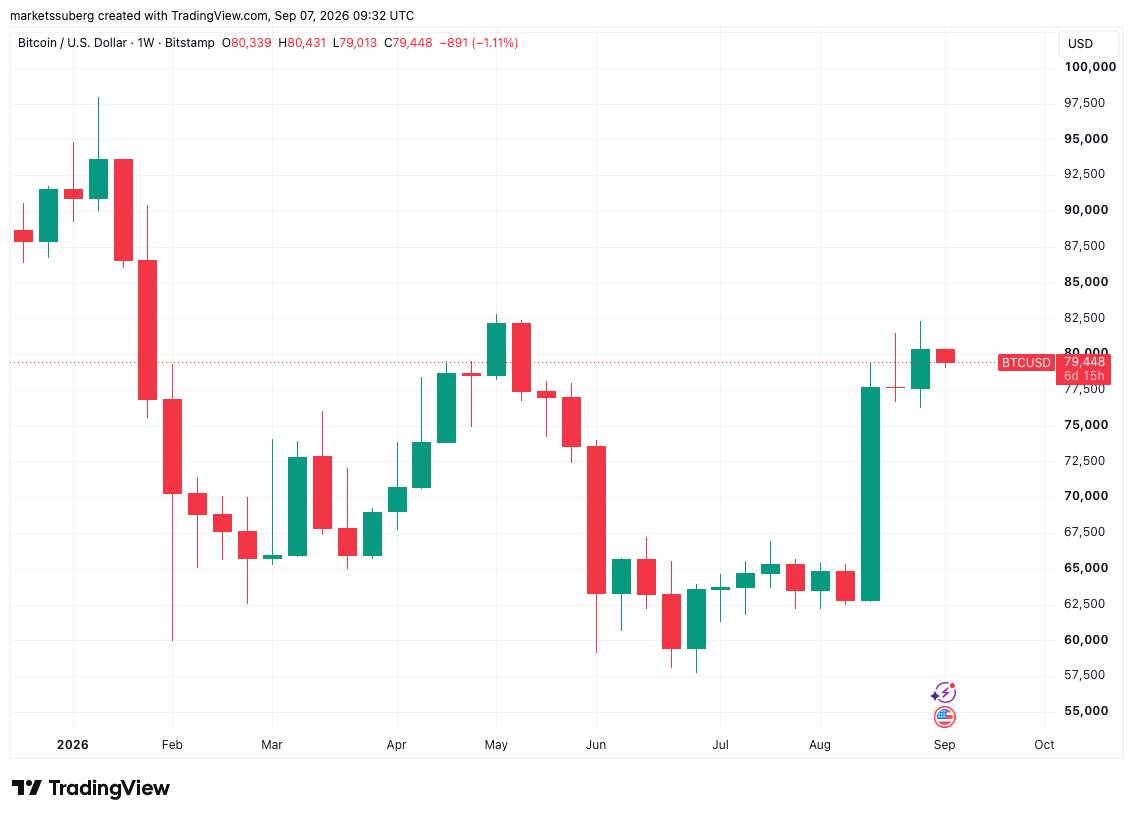
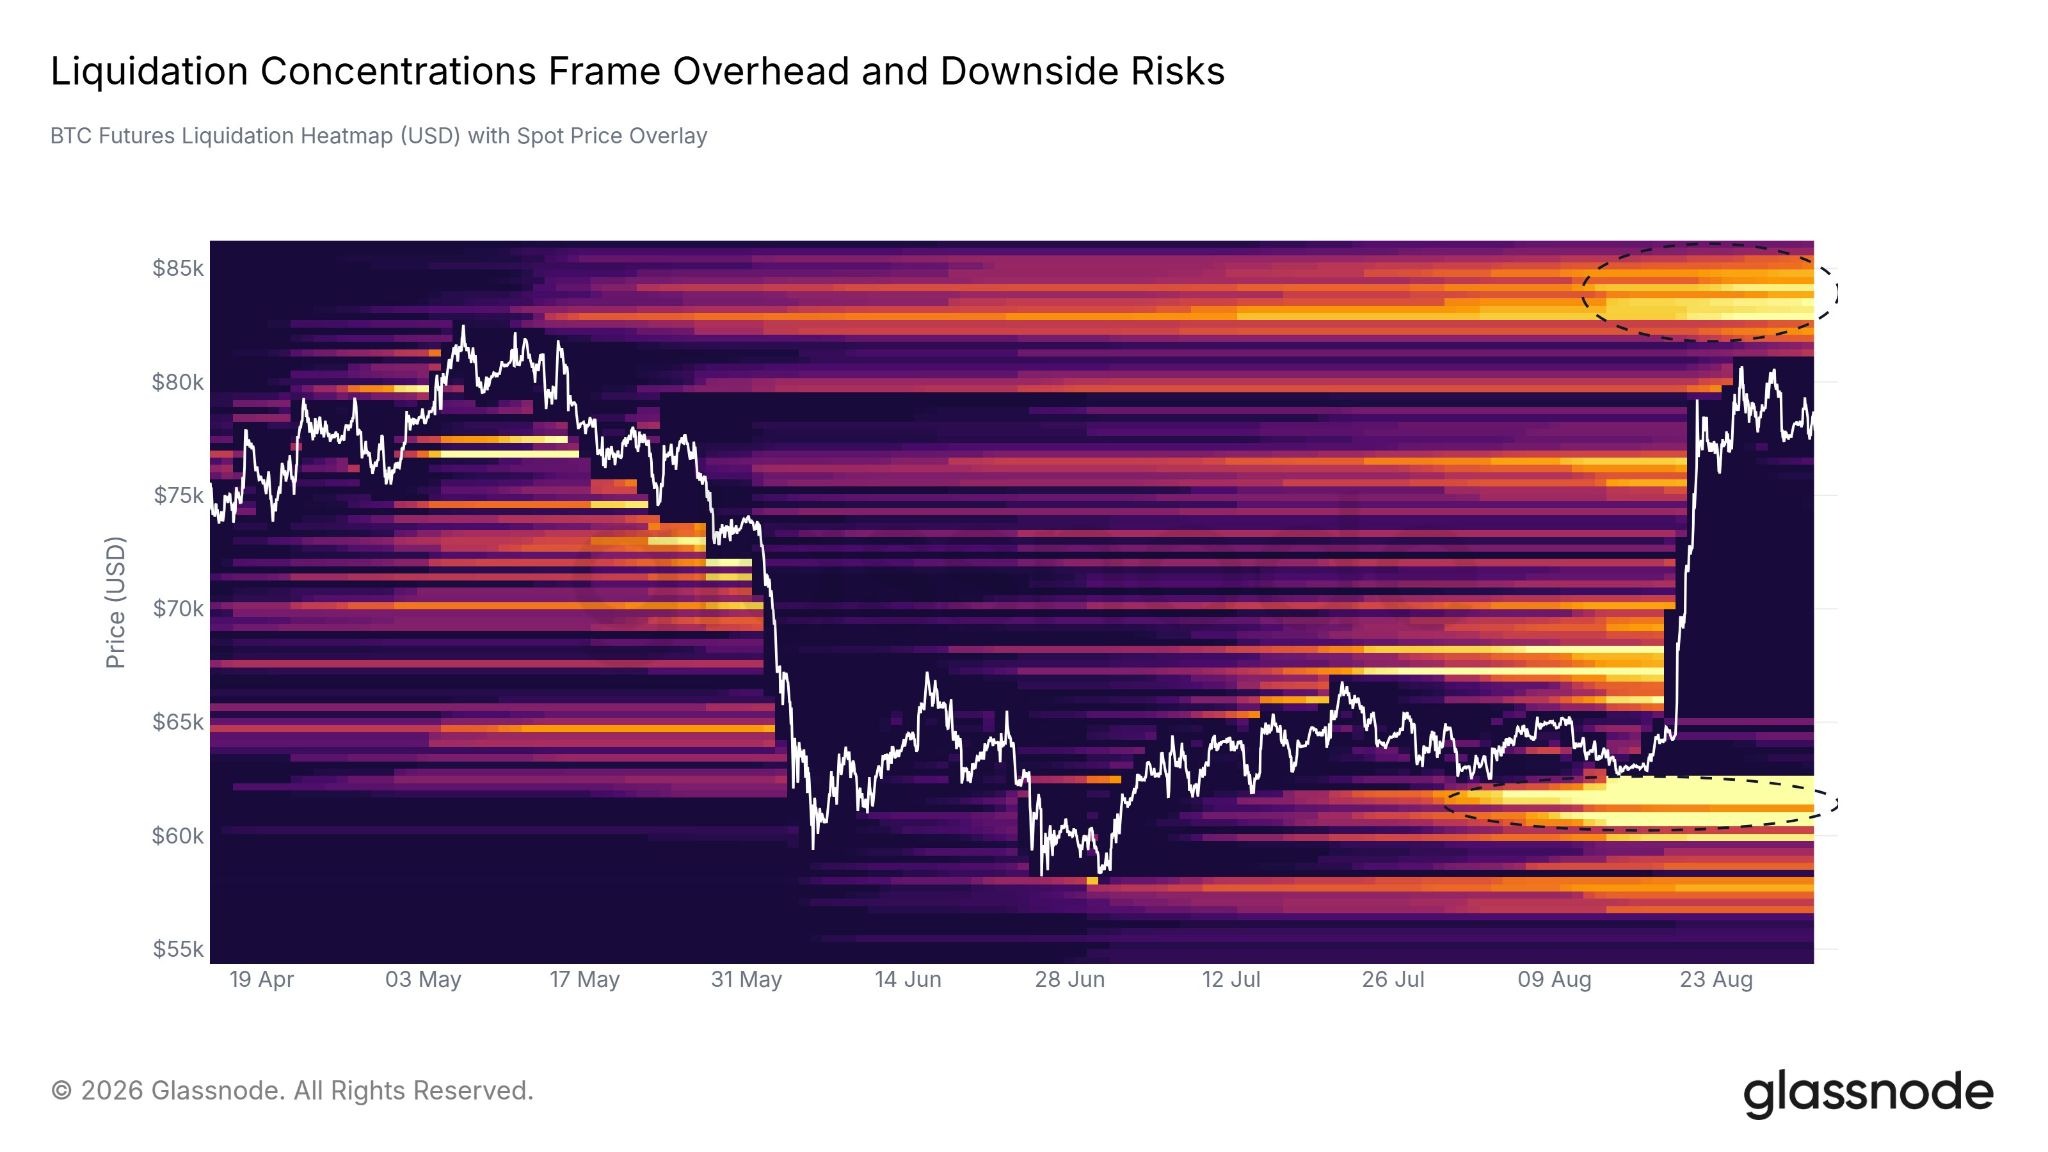
On Sunday, Bitcoin’s weekly close at just over $80,000 marked its highest point since the week of May 11th. However, the $80,000 level continues to present resistance, with bulls struggling to maintain consistent support above it as sell-side liquidity accumulates. Data from CoinGlass indicates concentrated liquidity around $80,560, forming a significant resistance barrier that is pinning BTC/USD within a narrow range. Onchain analytics platform Glassnode had previously identified large liquidity bands as crucial for shaping Bitcoin’s longer-term price action, highlighting a particular band between $83,000 and $86,000. This band represents a cluster of short liquidations that the recent price surge did not reach. Below the spot price, a band of long liquidation fuel remains between $60,000 and $63,000, creating a range within which the price is currently trading. Market participants are also considering potential resolutions to the current consolidation. Jesse Olson, developer of the Markets Sniper trading suite, has identified a bullish chart fractal from August 2023 that suggests $76,000 could serve as a local reversal point.
Adding to the bullish sentiment, a classic Bitcoin price trend indicator, the supertrend, flipped green on weekly timeframes for the first time since November 2025. A close above the supertrend line on weekly charts is considered a significant bullish signal, as it has historically not occurred within a bear market. The last instance of this indicator turning from red to green was in mid-January 2023, after Bitcoin had already surpassed its bear market bottom. Conversely, a flip from green to red has preceded protracted downtrends. This signal aligns with a growing number of indicators that have instilled confidence in some analysts that Bitcoin may have already seen its macro bottom at $57,000. In August, BTC/USD closed above its 50-week exponential moving average (EMA) for the first time since late 2025, an event historically significant for long-term bullish price trend reversals.