11
11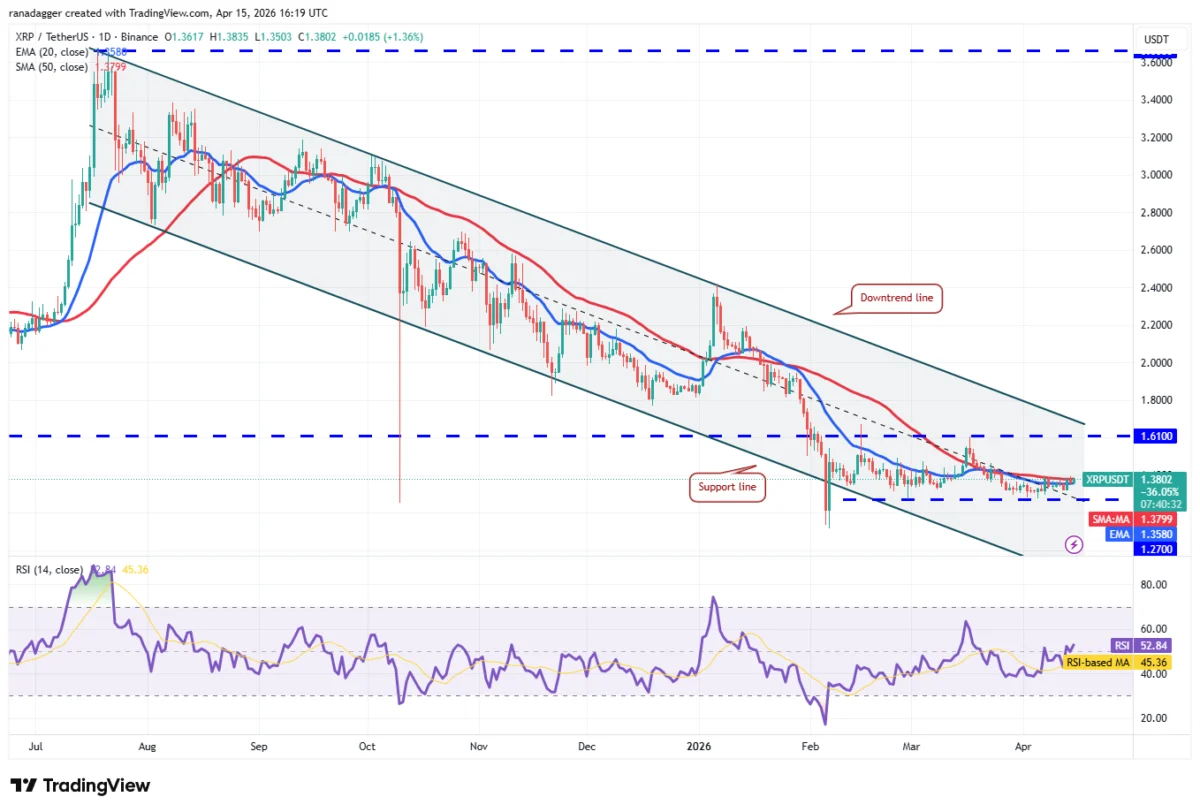
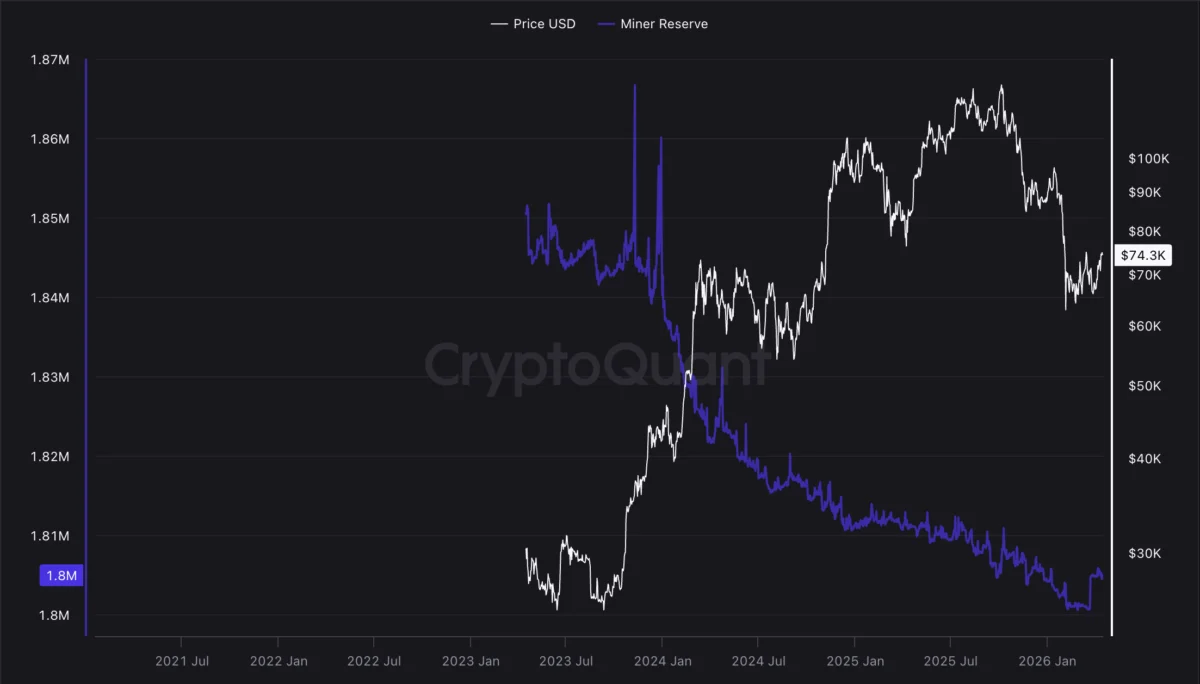
Bitcoin (BTC) experienced a slight pullback after breaching the $76,000 mark on Tuesday, but the resilience shown by bulls, who have maintained the price above $73,500, suggests a strong conviction in breaking through overhead resistance. This bullish sentiment is further bolstered by significant inflows into US spot Bitcoin exchange-traded funds (ETFs), which reached $411.5 million on Tuesday, according to SoSoValue data. This influx has propelled the total net flows for the year into positive territory, standing at approximately $245 million.
While some market analysts interpret these developments as confirmation that the market has found its bottom around $60,000, a segment of the analyst community remains cautious. These skeptics foresee a potential further decline, with some predicting a "final flush" below $60,000, potentially reaching as low as $50,000 before a sustainable bottom is established. The prevailing sentiment underscores the dynamic and often unpredictable nature of trend reversals in the cryptocurrency market, emphasizing the need for traders to remain agile and responsive to evolving chart signals.

Bitcoin Price Analysis
Bitcoin’s price action on Monday saw a notable upward movement from the 20-day exponential moving average (EMA) at $71,116, culminating in a test of the $76,000 resistance on Tuesday. This level is considered a critical juncture, as a decisive close above it would complete a bullish ascending triangle pattern, potentially paving the way for a rally towards $84,000. Sellers are expected to defend the $76,000 resistance with significant effort.
Conversely, any pullback is anticipated to find strong support at the 20-day EMA. A robust rebound from this moving average would signify sustained positive sentiment and enhance the probability of a breakout above the $76,000 resistance. A bearish scenario would be initiated by a close below the support line of the ascending triangle pattern.

Ether Price Analysis
Ether (ETH) is currently facing resistance at the $2,415 level. However, the fact that bulls have successfully defended their ground against bearish pressure provides an encouraging sign. The likelihood of a breakout above $2,415 increases if ETH experiences an upturn from its current price or bounces off the 20-day EMA at $2,198. Such a move could propel the ETH/USDT pair towards the $2,800 and subsequently the $3,050 targets.
For sellers to regain control, they would need to exert significant downward pressure, pushing the price below the moving averages to diminish bullish momentum. Failure to do so could lead to a decline towards the $1,916 support level.

XRP Price Analysis
Buyers are encountering challenges in driving XRP above the 50-day simple moving average (SMA) at $1.37, indicating active selling pressure at higher price points. If the price reverses and falls below the 20-day EMA at $1.35, it could signal a period of consolidation for the XRP/USDT pair, potentially within the range of the 50-day SMA and the $1.27 support. A decisive break below $1.27 would shift the advantage firmly to the bears.
On the upside, a close above the 50-day SMA would signify the commencement of a sustained recovery, with potential upward movement towards the descending channel’s downtrend line. Buyers regaining control would be evident with a close above this downtrend line.

BNB Price Analysis
BNB reached the 50-day SMA at $626 on Tuesday, a level where sellers have historically presented a strong challenge. If bulls can maintain their current position and prevent significant price erosion, the probability of a breakout above the 50-day SMA increases. This could lead to a rally in the BNB/USDT pair towards the overhead resistance at $687. Overcoming this barrier would clear the path for further gains towards $730 and potentially $790.
Conversely, a close below the $570 support level would indicate that bears have seized control, potentially initiating the next phase of the downtrend towards the $500 mark.

Solana Price Analysis
Solana’s (SOL) inability to sustain gains above the 50-day SMA at $85 suggests that sellers are actively defending this level. The current market conditions, characterized by flat moving averages and a Relative Strength Index (RSI) hovering near the midpoint, do not offer a clear advantage to either bulls or bears. This suggests that the SOL/USDT pair may continue to trade within the established range of $76 to $98 for the near future.
The next significant price movement is anticipated following a close above $98 or a break below $76. A decline below $76 would favor bears, potentially leading to a drop to $67. A close above $98, however, would open the possibility of a rally towards $117.

Dogecoin Price Analysis
Dogecoin (DOGE) experienced a breach of the moving averages on Tuesday, but the long upper wick on the candlestick indicates selling pressure on rallies. If the price falls back below the moving averages, bears are likely to attempt to push the DOGE/USDT pair below the $0.09 support. A successful breach of this level could see DOGE resume its downtrend towards $0.08 and then $0.06.
Alternatively, a move above the 20-day EMA at $0.09 and a subsequent break above $0.10 would signal a weakening of bearish grip. This could lead to a rally in the DOGE/USDT pair towards $0.11 and eventually $0.12.

Hyperliquid Price Analysis
Hyperliquid (HYPE) is currently experiencing a significant battle between bulls and bears at the breakout level of $43.76. If the HYPE price can rally from its current position and break above $45.30, it would indicate that the bulls have successfully converted the $43.76 level into support, increasing the likelihood of a move towards the $50 level.
However, if the price reverses and falls below the 20-day EMA at $40, it could suggest that the breakout above $43.76 was a bull trap. In such a scenario, the HYPE/USDT pair might experience a sharp decline towards the 50-day SMA at $36.77.

Cardano Price Analysis
Cardano (ADA) has been trading within a range defined by the 50-day SMA at $0.26 and the $0.23 support level for the past few days. The gradual downward trend of the 20-day EMA at $0.25 and the RSI residing in negative territory suggest a slight advantage for the bears. If the price turns downward and breaks below $0.23, the ADA/USDT pair could experience a significant drop towards the support line of the descending channel pattern. While there is support at $0.22, it is likely to be breached.
To signal a potential trend change, buyers would need to drive the ADA price above the downtrend line, which could then lead to a climb towards $0.36.

Bitcoin Cash Price Analysis
Buyers attempted to push Bitcoin Cash (BCH) above the 20-day EMA at $444, but sellers successfully defended this level. Sellers will likely aim to strengthen their position by driving the BCH price below $419. If they achieve this, the BCH/USDT pair could initiate a downward move towards the $375 level.
This bearish outlook would be invalidated in the short term if buyers successfully push the price above the moving averages, potentially leading to a rise to the $486 level, where sellers are expected to mount another strong defense.

Chainlink Price Analysis
Chainlink (LINK) has been trading in close proximity to the moving averages for the past few days, indicating a balance between supply and demand. The flat moving averages and an RSI just above the midpoint suggest that the LINK/USDT pair may continue to consolidate within the $8 to $10 range for some time.
The first indication of strength would be a decisive break and close above the $10 resistance, opening the possibility for a rally towards $10.94 and subsequently $11.61. Sellers are expected to defend the $11.61 level, as a close above it would signal a return of bullish momentum. Bears would need to drive the LINK price below the $8 level to gain a significant advantage.