11
11
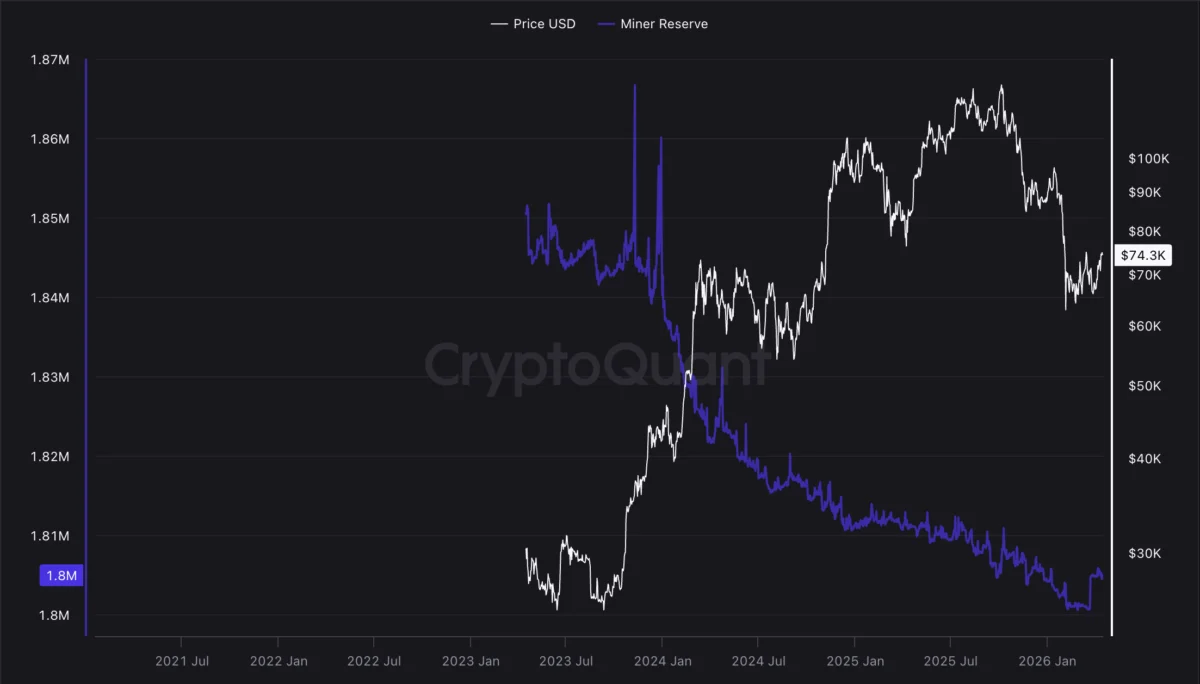
Bitcoin (BTC) approached five-week highs on Thursday as Wall Street opened, buoyed by inflation trends that remained within expected parameters. The January Personal Consumption Expenditures (PCE) Index, closely watched by the Federal Reserve as its preferred inflation gauge, met market expectations, coming in at 0.3% month-on-month and 3.1% year-on-year according to data from the Bureau of Economic Analysis. This reassuring inflation print provided a tailwind for risk assets, including Bitcoin, which saw its price climb towards the $74,000 mark.

The positive reaction in the crypto market mirrored that of traditional stock markets, with U.S. equities showing a gain of approximately 0.5% at the time of reporting. This development marked a divergence from the correlation observed earlier in the week, where both risk assets and cryptocurrencies had shown a positive relationship with oil prices. West Texas Intermediate (WTI) crude oil, in contrast, experienced a decline of 2% on the day, trading around $95 per barrel.
The stability in inflation figures has emboldened Bitcoin bulls, with the cryptocurrency testing new local highs. Data from TradingView indicated that BTC’s price was trading near $74,000, a level not seen for several weeks. While still elevated compared to late 2023, the PCE data’s adherence to forecasts appeared to alleviate concerns about aggressive monetary policy tightening from the Federal Reserve, which could otherwise have dampened investor appetite for riskier assets.

Looking ahead, the price forecast for Bitcoin remains a subject of discussion among market analysts. Crypto trader Michaël van de Poppe expressed cautious optimism, identifying a resistance zone between $76,000 and $79,000 for Bitcoin. He anticipates that a rapid breakout through this level is unlikely, but expects to see increased momentum in the altcoin markets within this price range. Van de Poppe noted that if Bitcoin reaches these higher levels, it would form a significant monthly engulfing candle on price charts, effectively negating the price correction experienced in February. He shared charts illustrating this potential scenario on the X platform, highlighting the psychological impact of such a move on market sentiment.
However, not all analysts share this bullish outlook. Trader Daan Crypto Trades issued a warning, suggesting that a breakdown below the current trading zone could trigger a significant price drop. A tweet from Daan Crypto Trades accompanied by a chart indicated a potential sharp decline if key support levels were breached. This perspective highlights the inherent volatility and differing interpretations of market signals within the cryptocurrency space.

Further contributing to the cautious sentiment, trader Roman, who has previously expressed a bearish stance, described the current upward movement in BTC/USD as a "bearish retest." Roman pointed to several technical indicators to support his view. He cited Relative Strength Index (RSI) bearish divergences, a pattern of decreasing volume alongside rising prices (indicating potential weakness in the uptrend), and a complete reset of the Moving Average Convergence Divergence (MACD) indicator on daily timeframes. These technical observations suggest that the recent price increase might be a temporary rebound before a potential downturn, rather than the start of a sustained rally. The analysis shared by Roman on X included charts illustrating these technical indicators and their implications.
In parallel, independent analyst Filbfilb focused on the behavior of Open Interest (OI) in his recent Telegram channel updates. He advised market observers to monitor for a decline in OI, suggesting that such a development would likely precede the end of any current upward price momentum. Filbfilb acknowledged that there were no immediate signs of a significant OI drop, but noted that Bitcoin’s price was currently interacting with its 50-day Simple Moving Average (SMA). This level has historically served as a key overhead resistance zone during previous attempts to break through it. The chart shared by Filbfilb illustrated Bitcoin’s price action against its 50-day SMA, underscoring its significance as a potential turning point.

The interplay between inflation data, broader market sentiment, and technical analysis continues to shape Bitcoin’s price trajectory. While the PCE figures provided a degree of comfort, the differing opinions among analysts underscore the speculative nature of the cryptocurrency market and the importance of ongoing monitoring of key economic indicators and technical levels. As Bitcoin navigates these influences, its ability to sustain its current momentum or face further corrections will depend on a confluence of factors, including future economic data releases, regulatory developments, and overall investor confidence. The 50-day SMA and the identified resistance zone between $76,000 and $79,000 are likely to be critical levels to watch in the coming days and weeks.
The market’s reaction to the PCE data suggests a temporary reprieve from inflation-driven fears, allowing Bitcoin to test higher price levels. However, the presence of bearish technical signals and cautionary remarks from some analysts indicates that the path forward may not be straightforward. The broader implications for risk assets and the cryptocurrency market will become clearer as more data emerges and market participants digest the current economic landscape. The focus remains on whether Bitcoin can consolidate its gains and push towards new all-time highs or if it will face a significant pullback as warned by some market observers.