 11

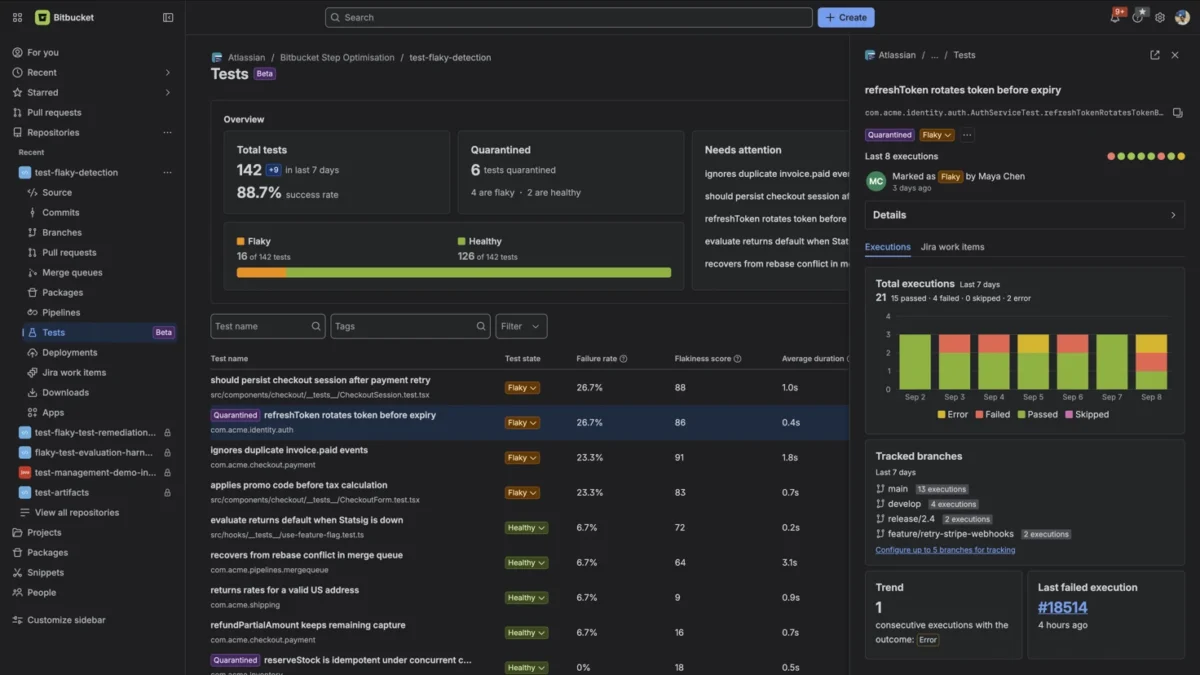
Atlassian has announced a significant expansion of its Bitbucket Tests capabilities, introducing comprehensive suite and individual test dashboards designed to provide deeper visibility into the health and reliability of automated testing within CI/CD pipelines. This update marks a strategic shift for Bitbucket, moving beyond simple pass/fail notifications to offer engineering teams a more nuanced, data-driven understanding of their testing environments. By focusing on historical trends, test stability, and actionable insights, the new features aim to reduce the friction caused by unreliable test suites and help developers prioritize maintenance tasks more effectively.
In the modern software development lifecycle, the reliance on automated testing within Continuous Integration and Continuous Deployment (CI/CD) pipelines is absolute. However, as development teams scale, the volume of tests often grows to a point where simply knowing that a test suite ran is insufficient for maintaining high-velocity delivery. Engineering leaders and developers increasingly require clarity on whether their test suites are fundamentally healthy, which specific tests are prone to failure, and how the behavior of individual tests has fluctuated over time. Bitbucket Tests’ new dashboards are engineered to provide these answers, offering tools specifically built to monitor and improve overall test health.
The core of this update is the introduction of a new overview dashboard for the full test suite. This centralized interface aggregates critical health information, allowing teams to assess the state of their testing infrastructure at a glance. The dashboard provides high-level breakdowns of the entire suite, categorizing tests into four distinct statuses: total, healthy, flaky, and quarantined. This categorization is vital for modern DevOps practices, where "flaky tests"—those that yield both passing and failing results without any changes to the code—can significantly undermine developer confidence and slow down the deployment process. By identifying these tests and allowing for their quarantine, Bitbucket enables teams to maintain the integrity of their pipelines while they investigate and resolve underlying issues.
A standout feature of the new overview dashboard is the "Needs attention" card. This dedicated component is designed to highlight the top tests currently impacting the health of the suite. Rather than requiring developers to manually sift through logs or execution histories to find the most problematic areas, the dashboard surfaces the most critical failures and inconsistencies. This prioritization allows teams to focus their limited maintenance time on the tests that cause the most significant disruptions, thereby improving the overall efficiency of the development cycle.
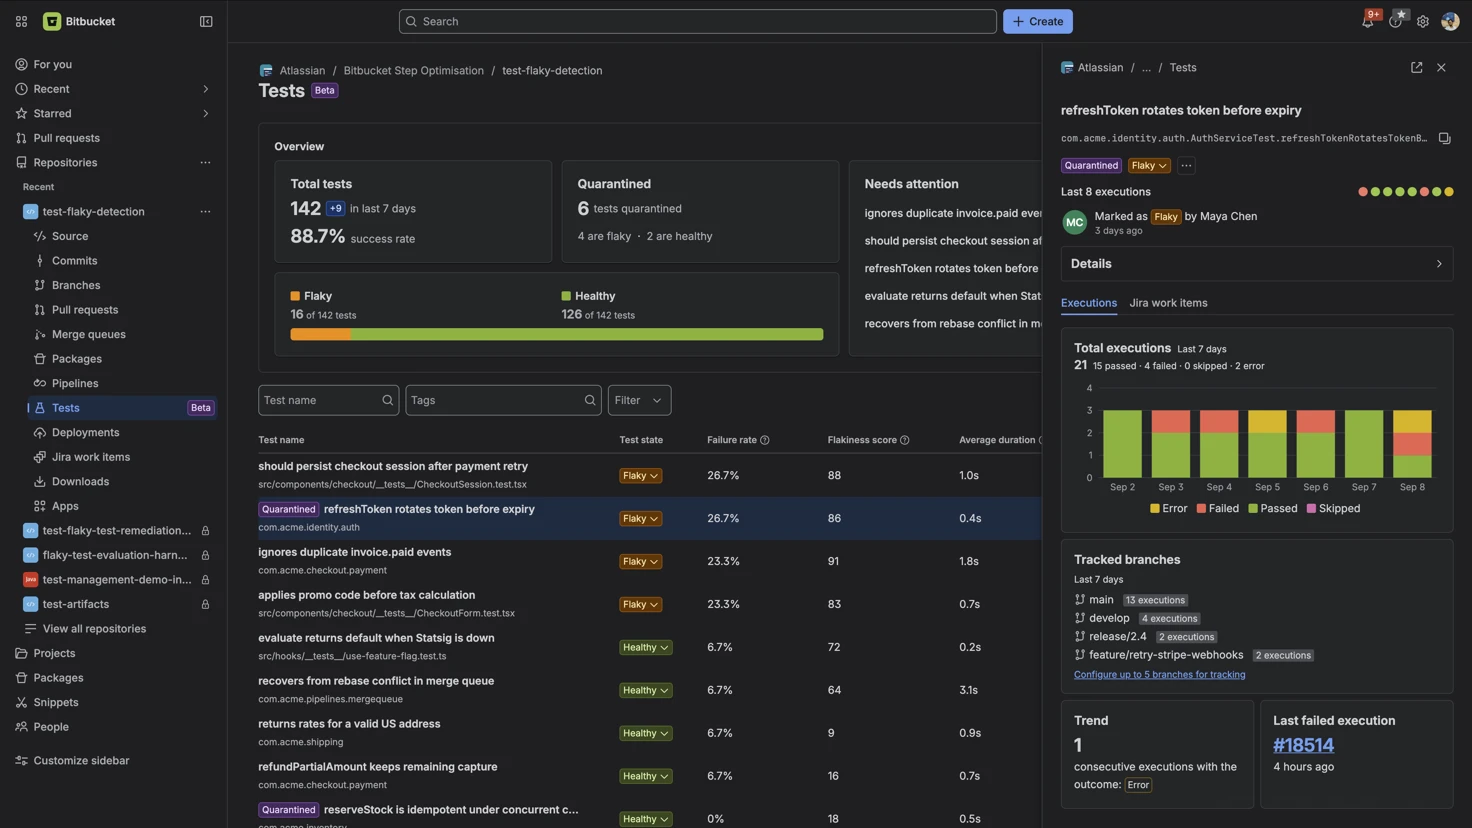
The integration between Bitbucket Pipelines and Bitbucket Tests has also been tightened. Results from Bitbucket Pipelines now feature direct links to Bitbucket Tests. By selecting the "View in Tests" option, users are transitioned from a specific pipeline execution to a detailed view of a test’s history and execution parameters. This seamless transition is intended to bridge the gap between execution and analysis, providing a direct path for debugging and performance monitoring.
Beyond the high-level suite overview, Atlassian has introduced individual test dashboards. These provide a granular look at the performance of specific test cases over time. Within these individual views, developers can explore a summary of the test’s behavior and a comprehensive execution history. This historical perspective is essential for identifying regressions or patterns of failure that might not be obvious in a single run. The individual dashboards also include robust filtering and navigation options, enabling users to isolate data based on specific branches, execution statuses, or timeframes. This level of detail is particularly useful for complex microservices architectures where a single test might behave differently across various environments or feature branches.
Bitbucket Tests and these new dashboard features are available to users on Bitbucket’s Standard and Premium plans. This positioning reflects the growing importance of test observability for professional engineering teams who require more than basic repository management. By providing these tools as part of the core Bitbucket experience, Atlassian is reinforcing the platform’s role as a comprehensive DevOps hub.
To leverage these new capabilities, development teams must follow a standardized integration process. The primary requirement is that tests must be executed within Bitbucket Pipelines and must generate JUnit-compatible test reports. JUnit is a widely adopted standard for reporting test results in the Java ecosystem and beyond, and its compatibility ensures that Bitbucket can accurately parse and visualize the data regardless of the specific testing framework used by the development team. Once a repository is configured to produce these reports, the data becomes accessible through the "Tests" section of the Bitbucket interface.
The workflow for utilizing the new dashboards is straightforward. Once the JUnit reports are being published by the pipelines, users can navigate to the "Tests" tab within their repository. The initial view is the overview dashboard, which provides the high-level suite health metrics and the "Needs attention" card. From there, users can drill down into individual tests to examine execution histories and use filters to focus on specific investigative targets, such as a particular branch or a specific failure status. The data in these dashboards is updated dynamically as pipelines run and publish new reports, ensuring that the information remains current with the latest code changes.

The introduction of these features addresses a common pain point in software engineering: the "noisy" test suite. When a test suite becomes unreliable, developers often begin to ignore failures, assuming they are "flaky" rather than legitimate bugs. This behavior, known as "alert fatigue," can lead to critical defects slipping into production. By providing a clear distinction between healthy, flaky, and quarantined tests, Bitbucket Tests helps restore trust in the automated testing process. Quarantining a test allows it to remain in the codebase without failing the build, giving the team time to fix it without blocking the rest of the organization’s progress.
Furthermore, the emphasis on historical trends helps teams move from reactive to proactive maintenance. By observing that a test’s execution time is slowly increasing or that its failure rate is beginning to climb on a specific branch, developers can intervene before a test becomes a major bottleneck. This focus on "test observability" is a growing trend in the industry, and Bitbucket’s update aligns the platform with these evolving best practices.
Atlassian has indicated that the evolution of Bitbucket Tests is an ongoing process driven by user feedback. The company has encouraged the developer community to engage with the new dashboards and share insights via the Atlassian Community forums. This feedback loop is intended to inform future updates and ensure that the tools continue to meet the practical needs of software teams.
In summary, the new suite and individual test dashboards in Bitbucket Tests represent a significant enhancement to Atlassian’s CI/CD offering. By providing clear visibility into test reliability, identifying problematic tests through the "Needs attention" card, and offering detailed historical data, Bitbucket is providing engineering teams with the tools necessary to manage the complexity of modern automated testing. As teams continue to strive for faster deployment cycles and higher code quality, the ability to monitor and improve test health directly within the repository management platform becomes an increasingly valuable asset. The requirement for JUnit-compatible reports ensures a broad range of compatibility, making these tools accessible to a wide variety of development environments hosted on Bitbucket’s Standard and Premium plans.