11
11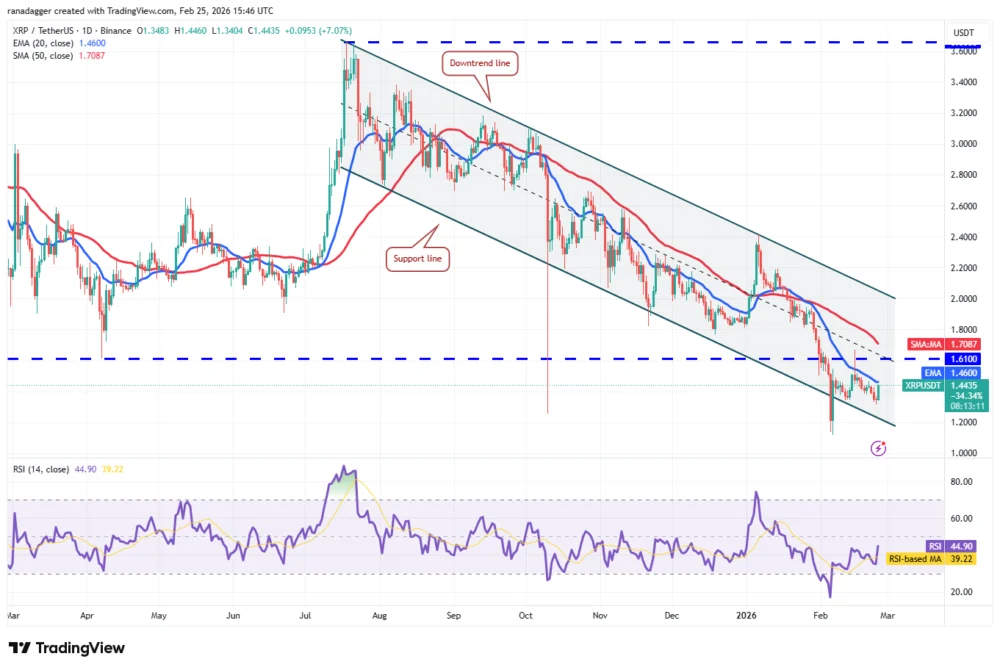
Bitcoin (BTC) bulls are actively working to sustain the cryptocurrency’s price above the crucial $69,000 mark on Wednesday, following a significant buying spree on Tuesday. Data from SoSoValue revealed that Bitcoin exchange-traded funds (ETFs) experienced net inflows totaling $257.7 million on Tuesday. This figure represents the largest daily inflow recorded since February 6th, indicating a growing investor sentiment that current price dips near the $60,000 level are presenting attractive buying opportunities.
Adding to the bullish sentiment, on-chain analytics firm Santiment observed a notable breakdown in the correlation between Bitcoin and traditional stock markets over the past six months. During this period, the S&P 500 saw a 7% increase, while Bitcoin experienced a 43% decline. However, Santiment cautioned that this disconnection is likely temporary. The firm suggested that if Bitcoin reverts to its historical pattern of tracking equities during economic expansions, it could possess "significant room to catch up," implying a potential for substantial upside.

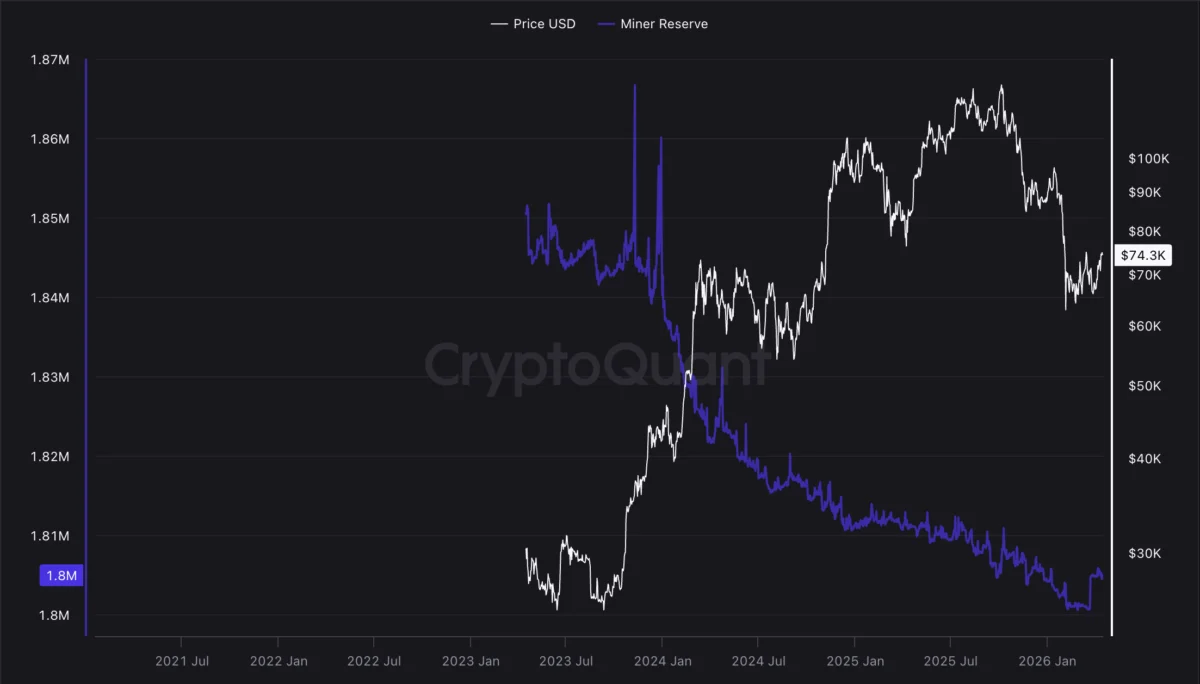
Despite these positive indicators, not all market observers are optimistic about Bitcoin’s short-term prospects. Glassnode, another analytics provider, noted in a post on X that Bitcoin’s realized profit/loss ratio, measured over a 90-day moving average, has dipped below 1. Historically, such declines below the 1 mark have preceded periods of extended loss realization, often lasting for at least six months before the ratio recovers. This suggests a potential for further downside pressure in the near future.
The current market data, as visualized in a heatmap from TradingView, illustrates the dynamic nature of the cryptocurrency landscape, with various digital assets showing different performance trends.
Bitcoin Price Analysis:

Bitcoin has demonstrated a strong recovery from Tuesday’s low of $62,510, underscoring the robust defense of the $60,000 support level by buyers. The immediate objective for bulls will be to propel the price above the 20-day exponential moving average (EMA), currently at $69,375. A successful breach of this resistance could pave the way for a rally towards the $74,508 breakdown level, where renewed selling pressure from bears is anticipated. Conversely, if sellers manage to defend the 20-day EMA and push the price down sharply, the $60,000 support may come under threat, potentially leading to a decline towards the $52,500 level.
Ethereum Price Analysis:
Ethereum (ETH) has shown resilience, turning upwards from the $1,800 level on Tuesday. This suggests an ongoing effort by buyers to maintain ETH within the established trading range of $1,750 to $2,111. A relief rally is expected to encounter resistance at the $2,111 mark. A sharp reversal from this level would likely prolong the consolidation within the current range. However, a decisive move above $2,111 would signal weakening bearish sentiment and could propel ETH towards the 50-day simple moving average (SMA) at $2,540, where further resistance is expected.

XRP Price Analysis:
XRP has experienced a sharp upward movement, reaching the 20-day EMA at $1.46, indicating a potential resurgence of bullish momentum. A close above the 20-day EMA could see XRP/USDT advance towards the 50-day SMA at $1.70 and subsequently test the downtrend line. Clearing this downtrend line would be a significant indicator of a potential trend reversal. Sellers, however, will aim to defend the moving averages and push the price back below the support line, potentially leading to a decline towards the February 6th low of $1.11 and then to $1.
BNB Price Analysis:

BNB has surged from $577, demonstrating aggressive buying interest around the $570 support level. For buyers to strengthen their position, a swift push above the 20-day EMA at $641 is necessary. Such a move could lead to a rally towards $669 and potentially $730. Conversely, a breakdown below $570 would indicate bearish control and could resume the downtrend towards the psychological level of $500.
Solana Price Analysis:
Solana (SOL) briefly dipped below the $76 support on Tuesday, but bears were unable to maintain the lower prices. The SOL/USDT pair is currently attempting a recovery, which is expected to face selling pressure at the 20-day EMA of $87. A sharp rejection from this level would increase the probability of a breakdown below $76, potentially leading to a decline towards the February 6th low of $67. However, if buyers can push the price above the 20-day EMA, the relief rally could extend to $95. A close above $95 would signal a return of bullish strength and could lead to a rally towards $117.

Dogecoin Price Analysis:
Dogecoin (DOGE) has rallied sharply from the $0.09 level, with bulls attempting to break above the 20-day EMA at $0.10. Sellers are anticipated to defend this moving average, and a rejection could lead to a drop towards the $0.08 support. Buyers are expected to defend this level vigorously, as a close below it could initiate the next leg of the downtrend towards $0.06. Maintaining the price above the 20-day EMA would indicate weakening bearish sentiment, potentially propelling DOGE/USDT towards the $0.12 breakdown level.
Bitcoin Cash Price Analysis:

Bitcoin Cash (BCH) experienced a sharp decline from the 50-day SMA of $564, falling below the $500 support on Monday. The downward turn of the 20-day EMA and the RSI in negative territory suggest a bearish advantage. Consequently, any relief rally towards the 20-day EMA is likely to be met with selling pressure. A rejection from this level could lead to a further drop towards $443. The first sign of strength would be a sustained close above the moving averages, potentially leading to a rise towards $580 and then $600.
Hyperliquid Price Analysis:
Hyperliquid (HYPE) has fallen below the 50-day SMA at $28.10, indicating an attempt by bears to seize control. While buyers are striving to push the price back above the moving averages, significant resistance from sellers is expected. A rejection from these levels could lead to a decline towards the support at $20.82. Conversely, a close above the 20-day EMA at $29.31 would suggest accumulation at lower levels and could lead to an ascent towards $32.50 and then to the resistance at $36.77. The next significant price movement is anticipated on a decisive close above $36.77 or below $20.82.

Cardano Price Analysis:
Cardano (ADA) has shown resilience, with bears failing to push the price down to the support line of its descending channel pattern, suggesting a lack of selling pressure at lower levels. Buyers are attempting to regain control by sustaining ADA above the 20-day EMA at $0.28. A successful defense of this level could lead to a rally towards the downtrend line. However, a sharp reversal from the downtrend line and a break below the 20-day EMA would indicate a continuation of the channel consolidation. A decisive close above the downtrend line is required for bulls to gain a significant advantage.
Monero Price Analysis:

Monero (XMR) experienced a breach of the immediate support at $309 on Monday, but bears were unable to sustain the lower prices. Bulls are currently attempting a relief rally, which is expected to face selling pressure at the 20-day EMA ($346) and then at the breakdown level of $360. A rejection from this overhead resistance could lead to range-bound trading between $360 and $300 for a period. The advantage would shift to bulls if they can push and maintain XMR/USDT above the $360 level, potentially leading to a surge towards the 50-day SMA at $435.