11
11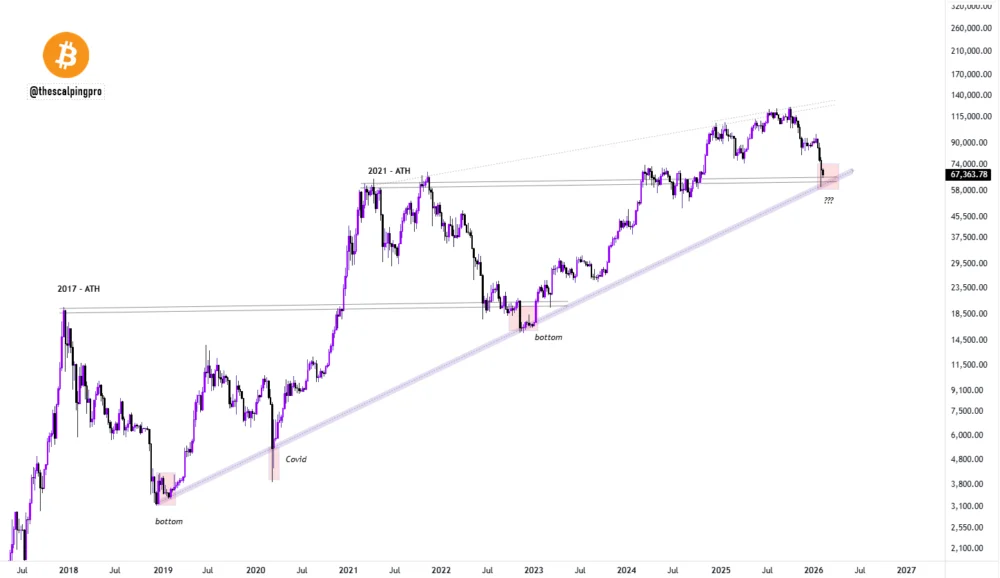
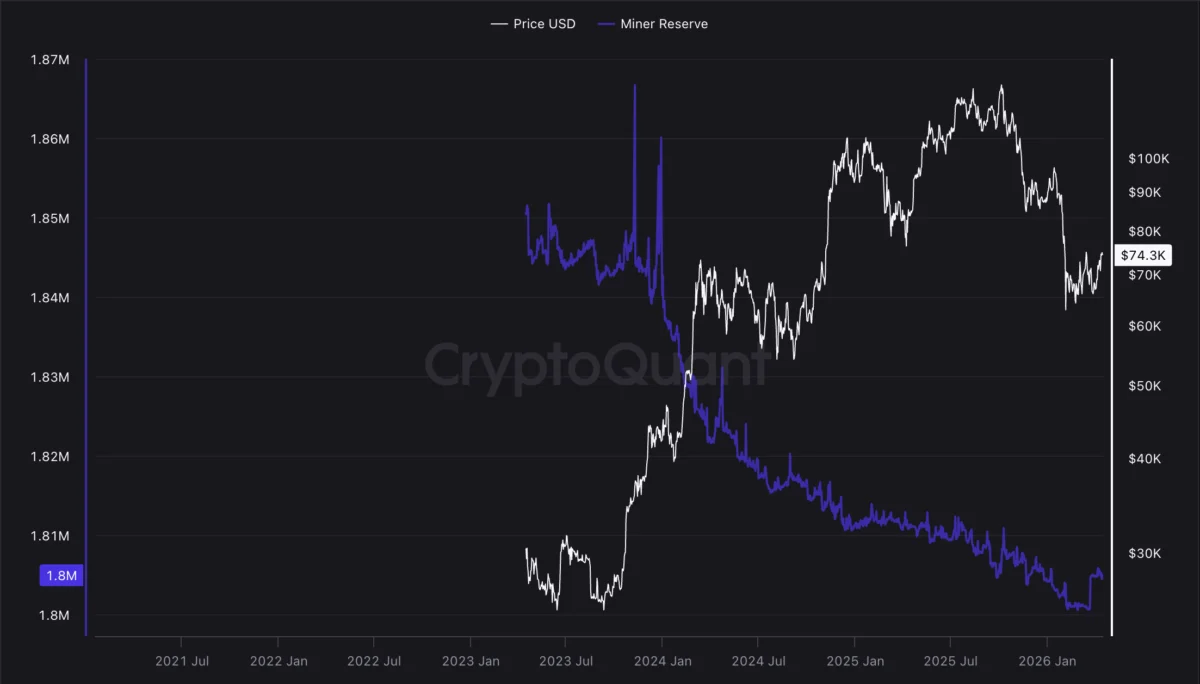
Bitcoin (BTC) may be on the cusp of forming a bottom in the coming weeks, as the market capitalization of Tether’s USDt stablecoin has plummeted to levels historically associated with the deepest troughs of Bitcoin’s 2022 bear market. This significant contraction in Tether’s market cap, a key indicator of liquidity and market sentiment, is drawing parallels to a period of extreme fear and forced selling that ultimately preceded a substantial recovery for Bitcoin.
On Sunday, Tether USDt’s 60-day market cap change registered a decline of $3.1 billion. This significant outflow has brought the stablecoin’s market cap into a historically significant zone, one that directly correlated with Bitcoin’s bear market lows in 2022. The only other instance where USDt’s market cap experienced a similar 60-day contraction of $3 billion or more was in late 2022. During that period, Bitcoin was actively carving out its cycle bottom, reaching lows near $15,500 amidst an environment of maximum fear and widespread forced selling.

A sharp decline in USDt’s market cap typically signifies a withdrawal of liquidity from the cryptocurrency market, a pronounced risk-off sentiment among investors, or a surge in forced redemptions. MorenoDV, a contributor to CryptoQuant, explained in a recent analysis that the current 60-day contraction points towards sustained capital outflows, indicative of a structural tightening in crypto-native liquidity. He further elaborated that while extreme liquidity stress has historically presented opportunities, these opportunities typically materialize only after selling exhaustion has been definitively confirmed.
The historical data, as illustrated by a chart from CryptoQuant, reveals a compelling correlation. Following the period in late 2022 when Tether’s 60-day market cap change dipped below -$3 billion, Bitcoin experienced a remarkable recovery, climbing to over $31,000 by March 2023. This represented a substantial 100% rally from the cycle bottom of approximately $15,500.
Adding further weight to this potential bottoming signal, Tether’s market cap shed $1 billion within the past day alone. This magnitude of daily decline has occurred on only two prior occasions in history, and each of those episodes coincided with either local or macro bottoms in Bitcoin’s price, or periods of sharp volatility. Analysts suggest that significant drops in USDt’s market cap often reflect the exit of institutional investors or large holders from the market. These exits, they argue, tend to occur "at or near exhaustion rather than at the beginning of sustained downtrends."

This analysis of Tether’s market cap behavior aligns with previous observations by Cointelegraph, which noted that Tether’s USDt stablecoin dominance had reached a key resistance level that had preceded Bitcoin’s 2022 cycle low. Consequently, the current trend of declining USDt dominance, coupled with confirmed seller exhaustion, could significantly increase the probability of Bitcoin finding a bottom in the upcoming weeks.
Beyond the on-chain metrics related to Tether, Bitcoin’s price action itself is presenting a technical setup on the weekly chart that bears a striking resemblance to patterns observed at previous market bottoms. According to analyst Mags, Bitcoin is simultaneously testing two major support zones. These include the ascending trendline support that historically marked the 2022 lows and a horizontal support zone derived from the all-time high reached in 2021.
Historically, this confluence of support levels has preceded significant multi-month price rebounds. For instance, this pattern was present before the 376% BTC price rally observed between November 2022 and March 2024, and also before the impressive 380% gains seen in the 2018-2019 period.

The optimistic outlook for Bitcoin’s future price trajectory is further supported by other market experts. As previously reported by Cointelegraph, a significant recovery for BTC is anticipated in 2026. Chase Guo, a former business development executive at Binance, has publicly stated her belief that Bitcoin will reach a new all-time high in 2026. Her conviction stems from an analysis of liquidity positioning within the market and evolving market mechanics. This sentiment is echoed by Bernstein, which maintains a $150,000 price target for Bitcoin in 2026, despite recent market downturns, suggesting that the current selloff reflects the weakest bear case on record.
The convergence of a historically significant drop in Tether’s market cap, mirroring conditions that preceded the 2022 bear market lows, and a familiar technical chart pattern suggesting a potential bottom, provides a compelling narrative for a forthcoming Bitcoin recovery. While the exact timing remains uncertain, these indicators collectively suggest that the cryptocurrency market may be approaching a crucial turning point. The confirmation of seller exhaustion will be a key factor in validating these optimistic signals.