 11
11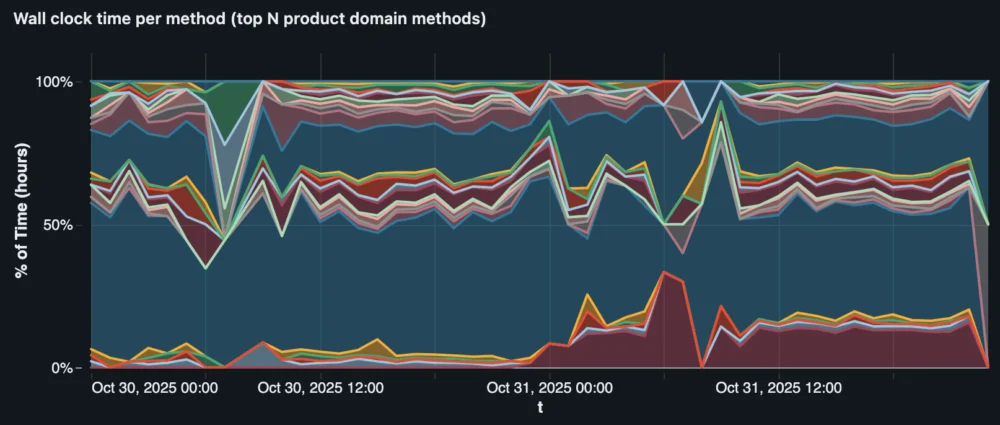
In the complex ecosystem of Jira Cloud, a multi-tenant platform serving millions of organizations, even minor system modifications can inadvertently degrade performance for high-scale customers. Because these regressions often affect only specific slices of the product—such as a single API endpoint used by administrative users across a handful of large tenants—they frequently remain invisible to global performance metrics. To address this challenge, Atlassian has developed a sophisticated per-tenant, per-endpoint detection system integrated with the Rovo Dev CLI. This new infrastructure allows engineering teams to identify not only when performance degrades but precisely why it occurred. In recent months, the system has successfully detected and mitigated more than eight distinct production regressions, preventing significant performance erosion while Atlassian continues its broader efforts to optimize the platform.

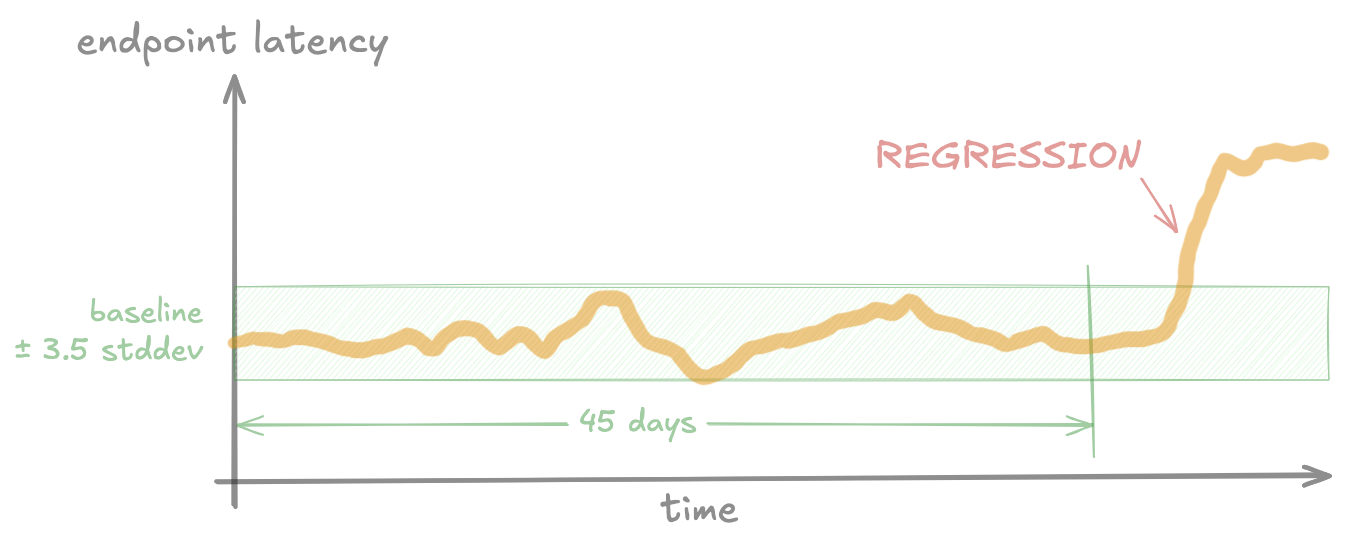
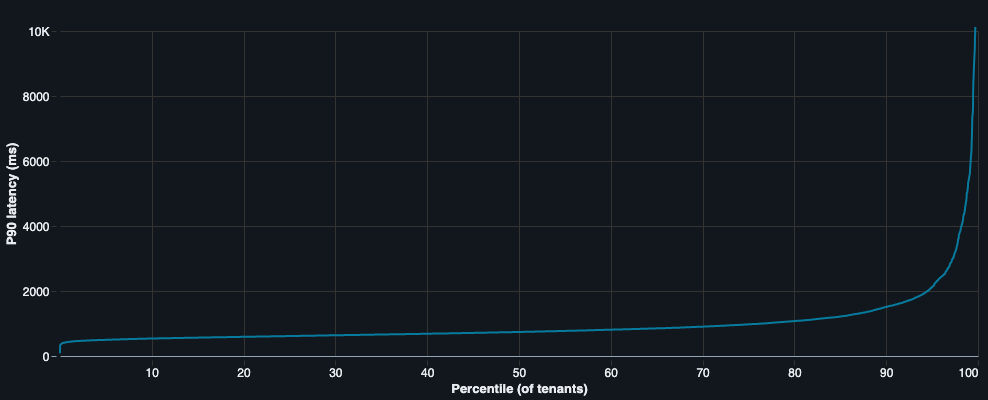
The core challenge in maintaining a service as massive as Jira Cloud lies in the definition of a performance regression. Traditionally, a regression is identified when a metric, such as latency, deviates negatively from its historical baseline—the "normal" performance level measured prior to a change. However, in a multi-tenant environment, "normal" is a relative term. Jira Cloud tenants vary significantly in scale and configuration; one organization might have a few dozen users and a hundred issues, while another might support tens of thousands of users with millions of issues and hundreds of custom fields. These variations mean that a code change or feature flag rollout that is harmless for 99.99% of tenants can be catastrophic for the 0.01% of customers operating at the extreme ends of the scale.
Standard industry monitoring often relies on aggregated metrics, such as the median (p50) or 90th percentile (p90) latency across a global cohort. While these high-level views are essential for monitoring overall system health, they tend to flatten out the granular problems that impact individual enterprise customers. A regression affecting only twenty of the largest tenants is often mathematically insignificant within a global p90 metric, allowing performance issues to accumulate over time. Similarly, fixed Service Level Objective (SLO) thresholds prove inadequate due to tenant diversity. If a threshold is set high enough to accommodate the slowest, most complex tenants, it will fail to trigger for faster tenants that experience a significant but sub-threshold slowdown. Conversely, a low threshold would result in constant "false positive" alerts for naturally slower, large-scale tenants.
To solve this, Atlassian’s new system focuses on detecting regressions when an individual tenant or a small cluster of tenants experiences increased latency on a specific backend endpoint, even if global health indicators remain stable. This requires three distinct components: granular per-tenant and per-endpoint performance data, a statistical detection engine capable of identifying shifts in that data, and an automated method for conducting root cause analysis (RCA).
The detection engine utilizes Statistical Process Control (SPC) techniques to differentiate between routine performance "noise" and genuine regressions. By analyzing historical data for each specific tenant-endpoint combination, the system can identify when current performance deviates statistically from the established baseline. When a regression is confirmed, the system automatically generates an alert within Jira Service Management (JSM), routing it to the internal engineering team responsible for the affected backend component.
However, detection is only the first step. Diagnosing the root cause of a regression in an environment where thousands of engineers commit code and toggle thousands of feature flags daily is a daunting task. Performance data is inherently noisy, and identifying the exact moment a regression began can be difficult. To streamline this, Atlassian integrated the detection system with an AI-driven RCA agent built on the Rovo Dev CLI. When an alert is triggered, this agent automatically initiates an investigation, performing tasks that would typically take a human engineer hours or days to complete.
A recent production incident from October 2025 illustrates the system’s efficacy. A backend feature flag, replace-metrics-check-ff, began rolling out across the production environment. While the change had no impact on the vast majority of users, it caused a sharp latency increase for 20 of Jira’s largest customers during specific backend operations related to issue views and boards. Because the impact was limited to a small number of tenants, global metrics showed no cause for alarm. The per-tenant detection system, however, immediately flagged the anomaly and deployed the Rovo RCA agent.

The agent followed a structured, multi-step investigation path. First, it gathered latency data from the affected tenants to build a precise timeline of the regression’s onset. Second, it queried Atlassian’s internal sampling profiler via SQL to compare backend execution profiles before and after the slowdown. This revealed that a specific method, TcsHttpClient.get(), had seen its total daily execution time on affected tenants jump from 1.37 hours to 15.3 hours—a 1016% increase.
Third, the agent correlated this timeline with feature flag evaluation data. It identified replace-metrics-check-ff as the primary suspect, noting a near-perfect correlation between the flag’s activation and the latency spike. Fourth, the agent performed a source code analysis. It discovered that the code change associated with the flag had replaced a cached metrics check with a call to the EditionService.getProductEdition() method. By tracing the call tree, the agent found that this new method triggered a blocking, uncached API call to the Tenant Context Service (TCS) via TcsHttpClient.get(). This call was being executed for every database connection and query, significantly amplifying the latency across the entire request lifecycle.

Finally, the agent synthesized these findings into a concise report on Confluence. The report detailed the specific commit, the nature of the synchronous network call, and the resulting percentage increase in execution time. Armed with this information, Atlassian engineers were able to disable the feature flag and mitigate the issue within hours, often before the impacted customers even realized a problem existed.
The development of this system provided Atlassian with several key insights into the future of site reliability engineering. One major takeaway was that detection is only half the battle. For such a system to provide value, it must be part of a broader business coordination framework. Atlassian utilized existing internal ownership data to ensure that every endpoint and source file was mapped to a specific team. This allowed for the automatic assignment of alerts, ensuring accountability. Furthermore, the company recognized that some regressions might be acceptable trade-offs for critical bug fixes, requiring a balanced approach to mitigation.

Another critical lesson involved the complexity of building AI agents for technical diagnostics. Initially, the team struggled with "over-fitting" the agent to specific scenarios. To resolve this, they developed a robust evaluation harness using real-world production regressions rather than synthetic data. This harness uses an "LLM-as-a-judge" pattern, where a high-order language model scores the agent’s RCA reports based on two criteria: whether it correctly identified the ground-truth root cause and whether its reasoning was sound. This benchmarking process ensures that the agent remains accurate even as the underlying platform and data types evolve.
Looking ahead, Atlassian plans to expand the coverage of this per-tenant detection system to all Jira endpoints and integrate even richer data sources, including infrastructure-level signals and product-specific context. By transforming performance management from reactive firefighting into a repeatable, automated workflow, Atlassian aims to maintain high performance across its entire customer base, regardless of their scale or complexity. The integration of statistical detection and agentic AI represents a significant shift in how large-scale SaaS providers protect the user experience in an era of continuous deployment and high architectural complexity.