 11


Bitcoin (BTC) has recently encountered difficulties in establishing the $80,000 level as a firm support, a challenge that crypto analytics firm Glassnode suggests is merely a precursor to a more significant hurdle for bulls. New research highlights key overhead liquidity structures and converging trend lines that point to a critical price corridor between $81,000 and $86,000, representing a significant test for Bitcoin’s upward momentum.
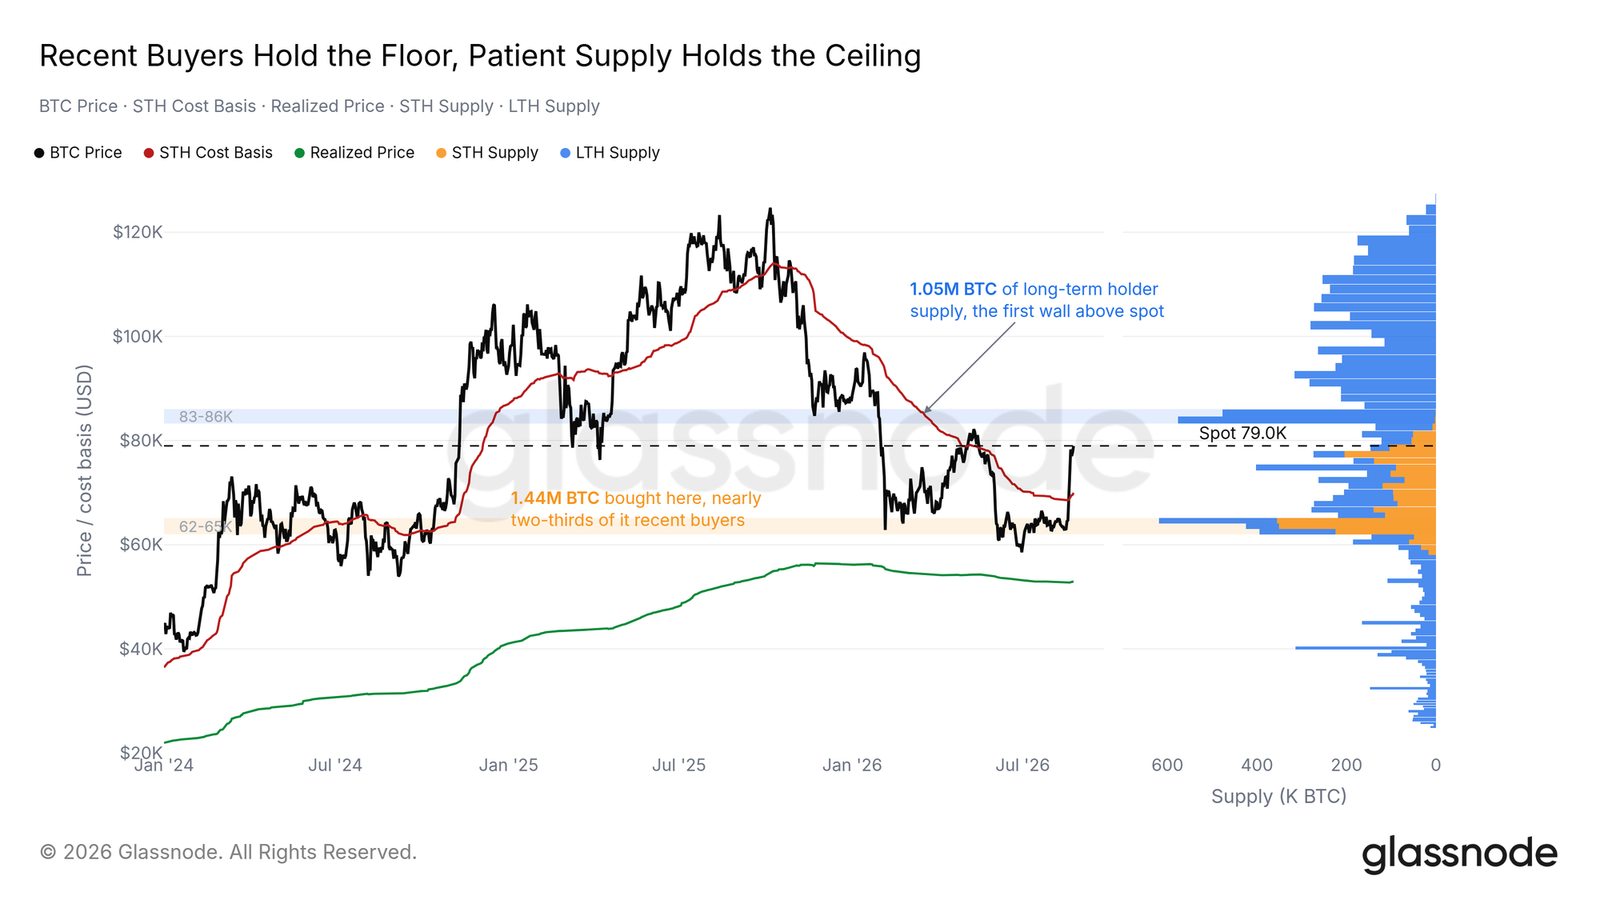
In its latest newsletter, "The Week Onchain," Glassnode identified multiple pools of Bitcoin supply poised for potential release into the market should the price ascend towards the $86,000 mark. A primary focus of this analysis is the behavior of long-term holders (LTHs), defined as wallets that have held BTC without selling for a minimum of six months. These LTHs represent a substantial segment of the market, and their decisions to hold or sell at current price levels could significantly influence Bitcoin’s trajectory.
Glassnode’s research indicates that a significant concentration of LTH supply resides within the $83,000 to $86,000 price band. This cohort has endured considerable market drawdowns, and the prospect of reaching $83,000 could present a crucial test of their resolve to resist selling at or near their breakeven points. The mental fortitude of these long-term investors will be a key determinant in whether Bitcoin can overcome this significant supply wall.

Beyond the LTH supply, the $81,000 to $86,000 zone is also characterized by the appearance of new "ask liquidity" on exchange order books. Glassnode notes that the owners of these orders may not necessarily intend for them to be filled. Instead, these "re-laddered asks" could be strategically placed to stay above the spot price, acting as a form of passive resistance should Bitcoin’s price continue to climb. This tactic can create the illusion of selling pressure, potentially deterring further immediate price appreciation.
The research further elaborates on the confluence of various market indicators within this critical price range. Glassnode points to a "self-custody cost-basis shelf" beginning at $80.8K, suggesting a level where a significant number of holders acquired their BTC and might consider selling to break even. Additionally, "dealer gamma flips negative" at $82.3K, a technical indicator that can signal a shift in market dynamics and potentially increase price volatility. A "surviving liquidation shelf" extends to $86K, indicating a price level where leveraged positions could be at risk of liquidation, adding another layer of complexity. Finally, the "patient-supply wall" of LTHs, as previously mentioned, fills the $83K-86K range.
Collectively, Glassnode concludes that "every overhead structure we track now sits between $81K and $86K; that band is where the recovery’s demand meets its test." This statement underscores the significance of this price corridor as the next major battleground for Bitcoin, where the strength of buying demand will be pitted against the considerable supply and potential selling pressure from various market participants.
Adding to the confluence of resistance, multiple price trend lines are converging around the $80,000 mark, further solidifying its role as a significant resistance hurdle. Data from TradingView reveals that Bitcoin’s 50-week exponential moving average (EMA) currently stands at $77,353, while the 100-week EMA is positioned at $78,485. These longer-term moving averages often act as dynamic support or resistance levels, and their proximity to $80,000 suggests a psychological and technical barrier.
Furthermore, Bitcoin’s 365-day volume-weighted average price (VWAP) is situated around $82,600. The VWAP, which incorporates trading volume into its calculation, provides a more nuanced view of the average price at which an asset has traded over a specific period. Its placement within the critical $81,000-$86,000 zone further reinforces the notion that this area represents a significant point of contention for market participants.
The challenges facing Bitcoin at these higher price levels are not entirely new. Cointelegraph has previously reported on the skepticism of market participants regarding the sustainability of Bitcoin’s rapid rebound. The market has experienced periods of significant volatility, and the question of whether the current upward momentum could be sustained has been a recurring theme.
Trader and analyst Rekt Capital has previously emphasized the importance of holding key technical levels for a sustained trend change. Specifically, holding the 50-week EMA for an extended period is often considered a prerequisite for a meaningful bullish trend reversal. The current struggle to firmly establish $80,000 as support, coupled with the identified overhead supply and technical indicators, suggests that Bitcoin bulls face a formidable task in breaking through the $81,000-$86,000 resistance zone.
The broader market context also plays a role. The persistent bear market timing, which some analyses suggest could continue until the end of 2026, adds a layer of caution for investors. This longer-term outlook implies that any upward price movements might be met with increased selling pressure as participants look to exit positions before potential future downturns.
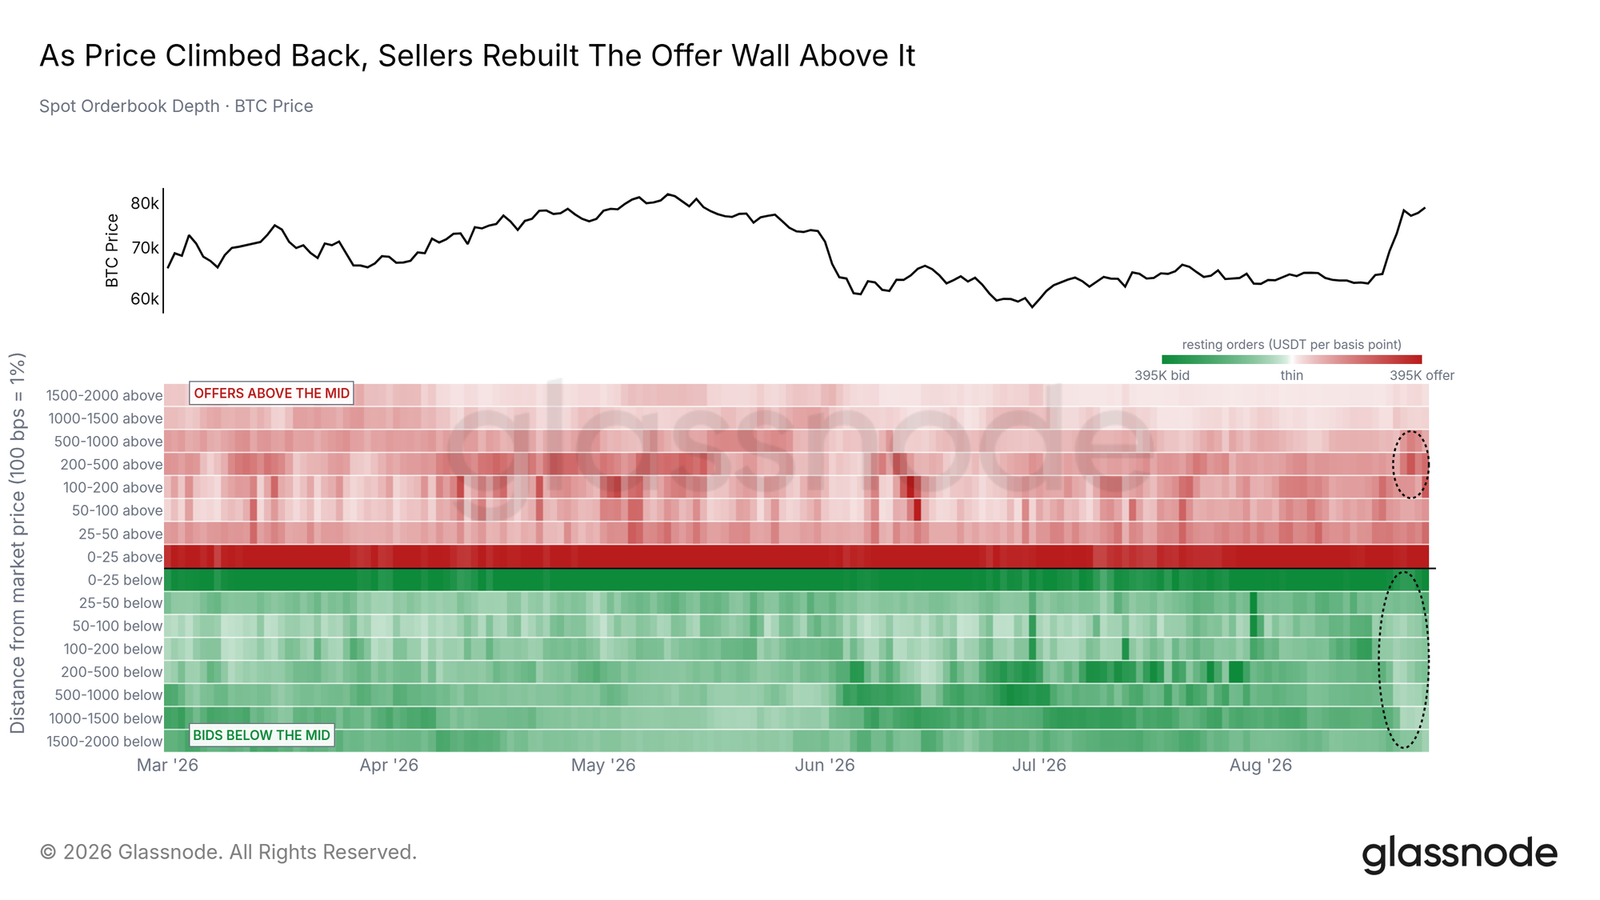
The upcoming price action in the $81,000 to $86,000 range will be crucial in determining Bitcoin’s short-to-medium term trajectory. The interplay between the selling pressure from long-term holders, strategic order book placements, and the confluence of technical indicators will dictate whether Bitcoin can overcome this significant hurdle and continue its ascent, or if it will face a period of consolidation or even a pullback. The resolve of both bulls and bears will be tested in this critical price discovery phase.