11
11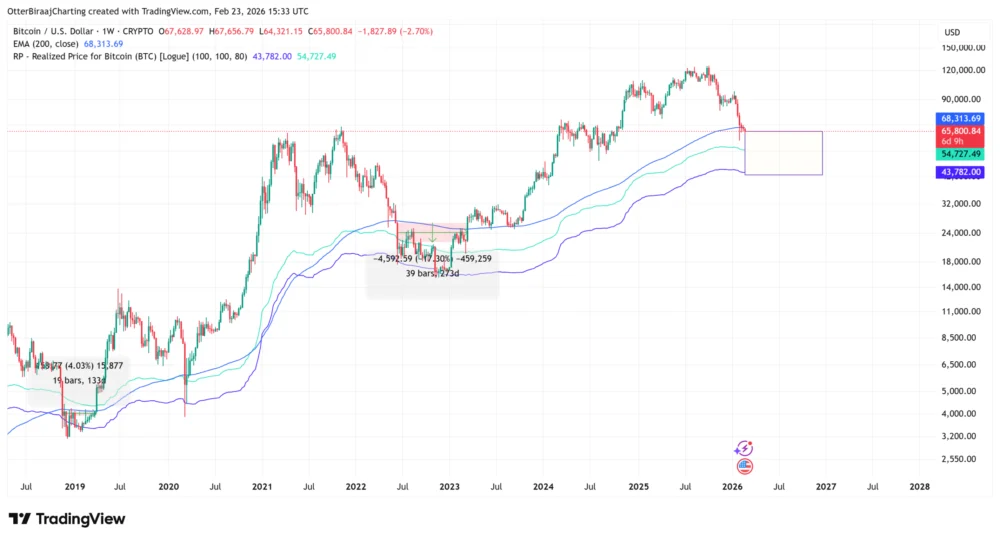
Bitcoin (BTC) has marked a significant technical turning point, closing its weekly candle below the crucial 200-period exponential moving average (EMA) for the first time since October 2023. This development officially ends a remarkable technical uptrend that had persisted for an impressive 882 days, reigniting focus on the cryptocurrency’s on-chain cost-basis levels and its historical interactions with key moving averages across previous market cycles. The implications of this shift suggest a potential recalibration of Bitcoin’s recovery timeline, drawing parallels with past market behaviors to frame future expectations.
The 200-week EMA serves as a critical indicator of Bitcoin’s long-term trend, historically acting as a dividing line between periods of market expansion and deeper corrective phases. The recent weekly close occurred near the $67,628 mark, breaching this significant average and concluding a support streak that had been in place since late 2023. This breach carries substantial technical weight.

Renowned crypto analyst Rekt Capital highlighted the implications of this event, stating, "This technically means that the EMA has been lost as support and that price could turn it into resistance on any upcoming recovery." This observation suggests that the 200-week EMA, once a floor for Bitcoin’s price, may now act as a ceiling, presenting an obstacle for any immediate upward price movements.
Historical data from previous market cycles provides valuable context for understanding the potential duration of Bitcoin trading below this key moving average. In the bear market of 2018, for instance, Bitcoin remained below the 200-week EMA for approximately 14 weeks before successfully reclaiming it. A more rapid recovery was observed during the COVID-19-induced liquidity shock in March 2020, where it took roughly eight weeks to regain this level. However, the most extended period below the average occurred in 2022, with BTC trading under the 200-week EMA for nearly 30 weeks. Across these past instances, the average duration spent below this critical long-term indicator has been approximately 17 to 18 weeks.
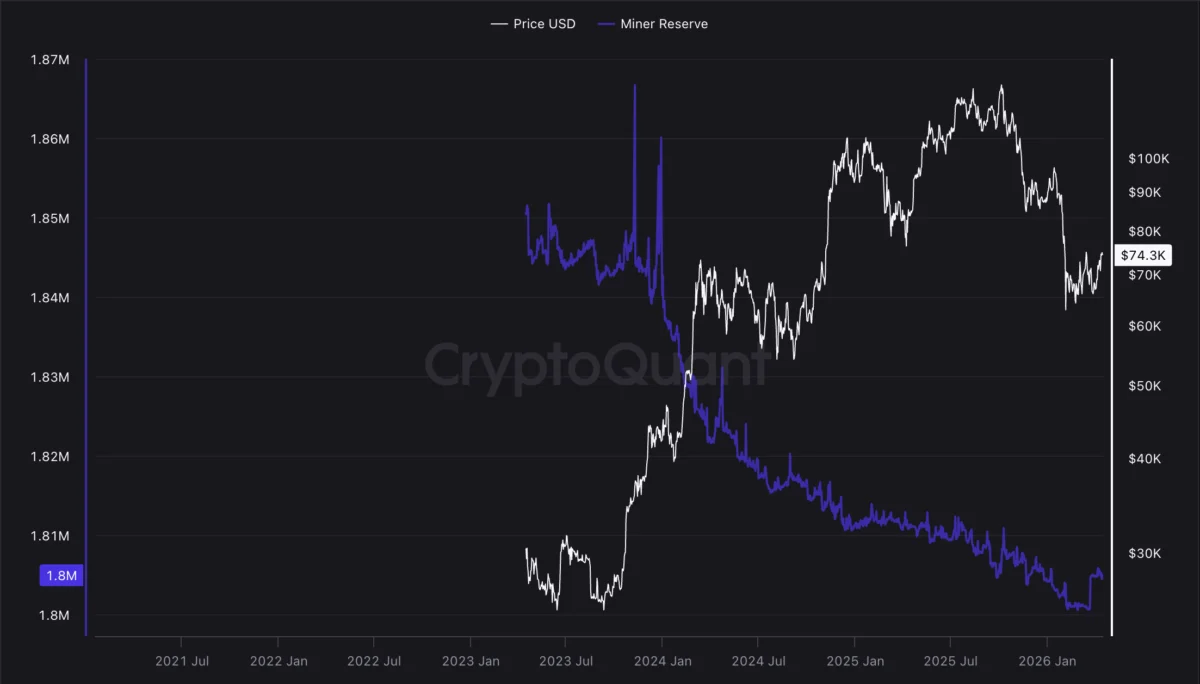
Further reinforcing the notion of a cooling market and potentially longer accumulation phases, momentum indicators are also reflecting a slowdown in longer-term investor participation. Bitcoin researcher Axel Adler Jr. recently noted that the entity-adjusted liveliness metric, which gauges the activity of coins on the blockchain, peaked in December 2025, shortly after Bitcoin reached an all-time high near $126,000 in October.

The entity-adjusted liveliness metric is calculated by comparing the ratio of coin days destroyed to coin days created, with adjustments made for internal transfers to filter out non-economic activity. Since its peak, this metric has seen a decline, falling below its 30-day and 90-day moving averages. While the 90-day moving average currently remains above the 365-day moving average at 0.02622, similar patterns of rollover in 2020 and 2022 preceded extended accumulation phases that lasted between one and two years. A sustained decline in liveliness is generally indicative of reduced spending activity and a slower rotation of capital within the network. These conditions could potentially lengthen the time required for Bitcoin to rebuild its position and successfully reclaim the 200-week EMA.
Examining Bitcoin’s on-chain cost basis provides further insights into potential demand zones. The realized price, which represents the average on-chain cost basis of all Bitcoin coins, currently stands near $55,000. A shifted realized price, projected forward, indicates deeper value areas during market drawdowns and is currently positioned near $42,000.
Historically, the region between the 200-week EMA and the realized price bands has acted as a significant long-term accumulation zone for Bitcoin investors since 2015. Previous market cycles have shown that consolidation periods around these levels can last for six to eight months before a broader upside continuation occurs.

The technical significance of reclaiming the 200-week EMA cannot be overstated, as it would signify a return to price action above a key long-term trend threshold. Conversely, a sustained failure to regain this level will likely keep the focus on the $55,000 realized price and the lower shifted band near $42,000 as potential areas where liquidity could concentrate, providing support during periods of price decline. The current market structure, with the weekly close below the 200-week EMA, suggests that investors and traders should prepare for a potentially longer consolidation or accumulation phase, drawing upon historical precedents to navigate the evolving market landscape.