11
11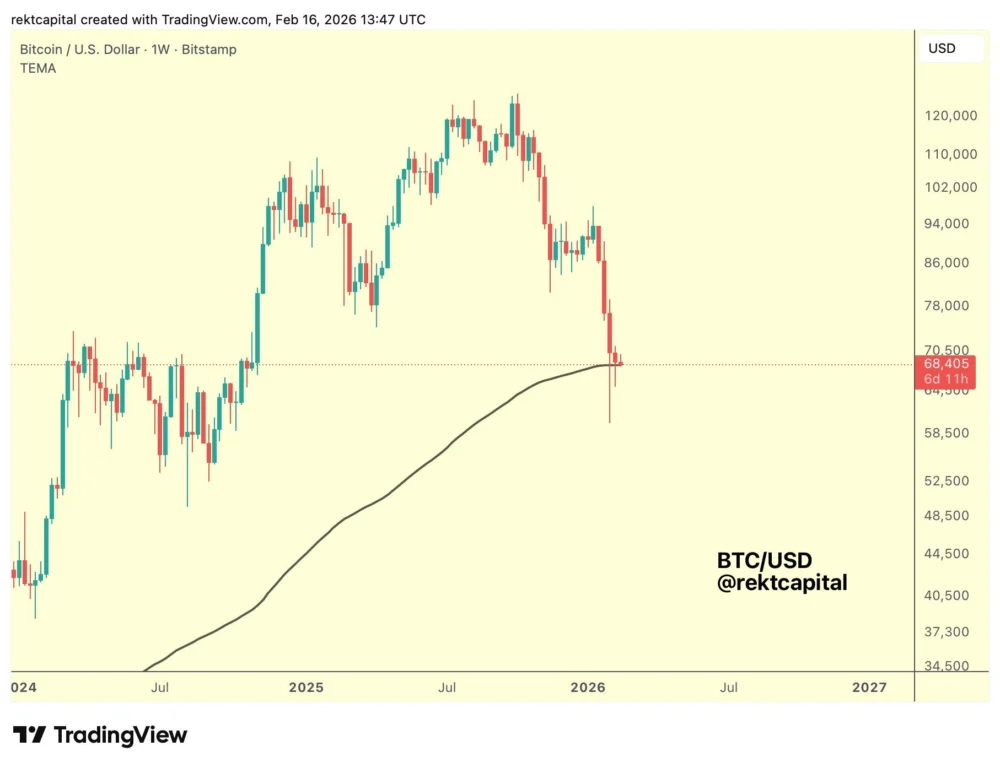
Bitcoin (BTC) analysts are closely monitoring key price levels as the cryptocurrency market’s attention converges on the $58,000 to $65,000 range, identified as a significant line of defense. This critical juncture is being scrutinized by traders and investors alike as they attempt to decipher the short-term trajectory of the flagship digital asset.
The current price action for Bitcoin has positioned it in a narrow band, squeezed between two significant technical indicators: the 200-week simple moving average (SMA) currently standing at $68,300 and the 200-week exponential moving average (EMA) at $58,400. Historically, this zone between the 200-week SMA and EMA has been a fertile ground for the formation of major Bitcoin bottoms. According to analyst Jelle, this pattern suggests that Bitcoin may be in the process of establishing a new price floor within these trendlines. This observation is particularly noteworthy given Bitcoin’s recent price fluctuations and the broader market sentiment.

Despite closing above the 200-week EMA for the second consecutive week, a significant milestone, trader and analyst Rekt Capital cautions that this does not necessarily signal an immediate escape from potential downward pressure. In a recent X post, Rekt Capital elaborated on the risks, stating, "The absence of any meaningful upside from here going forward, there is a risk that BTC loses the 200-week EMA in time, triggering additional downside." This warning highlights the precarious balance the market currently holds and the importance of sustained upward momentum. The visual representation of Bitcoin’s weekly chart, provided by Rekt Capital, underscores the significance of these moving averages as potential support and resistance levels.
Adding another layer to the technical analysis, crypto investor and entrepreneur Ted Pillows has outlined a bullish breakout target of $71,000. In a recent X post, Pillows emphasized the necessity of a daily close above this level to bolster the prospects of an upside rally. Conversely, he warned of potential downside if a breakdown occurs below $66,000, suggesting that Bitcoin might then revisit the $60,000 mark. Pillows’ chart analysis, focusing on a two-day BTC/USD timeframe, further illustrates these crucial price points and their potential implications for market direction.
Further reinforcing the bullish outlook, previous reporting by Cointelegraph highlighted the potential influence of the CME gap, located between $80,000 and $84,000. This gap, which represents a price range where futures contracts have not traded, is often seen as a magnet for price discovery. With a remarkable track record of nine out of ten CME gaps being filled since August 2025, the $80,000 to $84,000 range is identified as a key upside target to monitor. This suggests that while current price action is focused on lower levels, longer-term optimistic scenarios remain on the table, contingent on overcoming intermediate resistance.

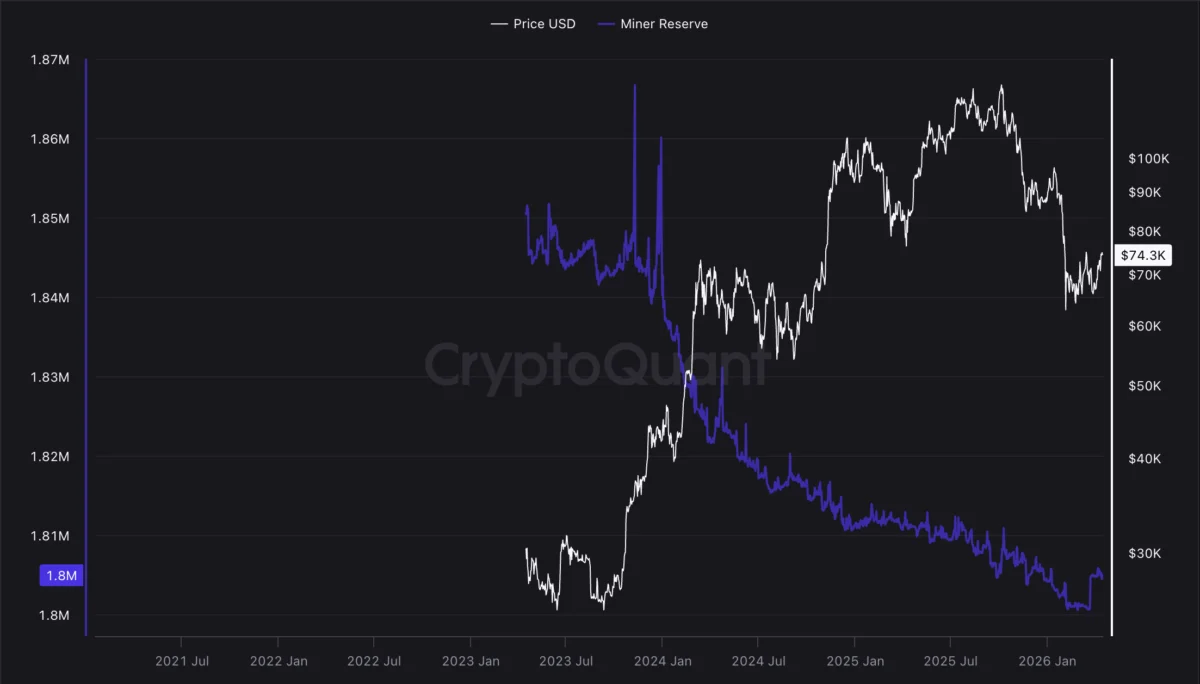
The immediate focus for Bitcoin bulls, however, remains on defending the $65,000 level. Following a rejection from the $72,000 mark last week, Bitcoin found initial support around $65,000. Data from Glassnode’s cost basis distribution heatmap reveals a substantial support area recently established between $63,000 and $65,000. This zone is significant because it represents a concentration of purchases by long-term holders, who have acquired approximately 372,240 BTC within this range.
A decisive breach below this $63,000 to $65,000 cluster would likely open the path towards the "realized price," a metric representing the average acquisition cost of all Bitcoin, which currently hovers around $55,000. Glassnode’s analysis, shared via X, underscores the criticality of this support zone for maintaining current market stability. The heatmap visually confirms the density of Bitcoin ownership within this price band, indicating strong conviction from a segment of long-term investors.
Current market analysis suggests that bears may attempt to consolidate their control by keeping BTC price below $65,000. If this strategy proves successful, the BTC/USDT trading pair could retest the critical $60,000 support level. Should this psychological and technical barrier falter, the next significant downside target would likely be around $52,500. This scenario paints a picture of potential further consolidation and downside risk if the immediate support levels fail to hold.

The interplay between these various technical indicators and price levels paints a complex picture for Bitcoin. While historical patterns suggest the formation of a bottom within the current trading range, the immediate threat of further downside remains a significant concern. The ability of Bitcoin to decisively break above key resistance levels, such as $71,000, or to hold firm above critical support, like the $63,000 to $65,000 zone, will be pivotal in determining its short-to-medium term trajectory. Investors and traders are therefore advised to maintain a close watch on these defined price boundaries as they navigate the evolving cryptocurrency market landscape. The ongoing battle between bullish and bearish forces at these key levels will ultimately shape the next significant move for Bitcoin.