 11
11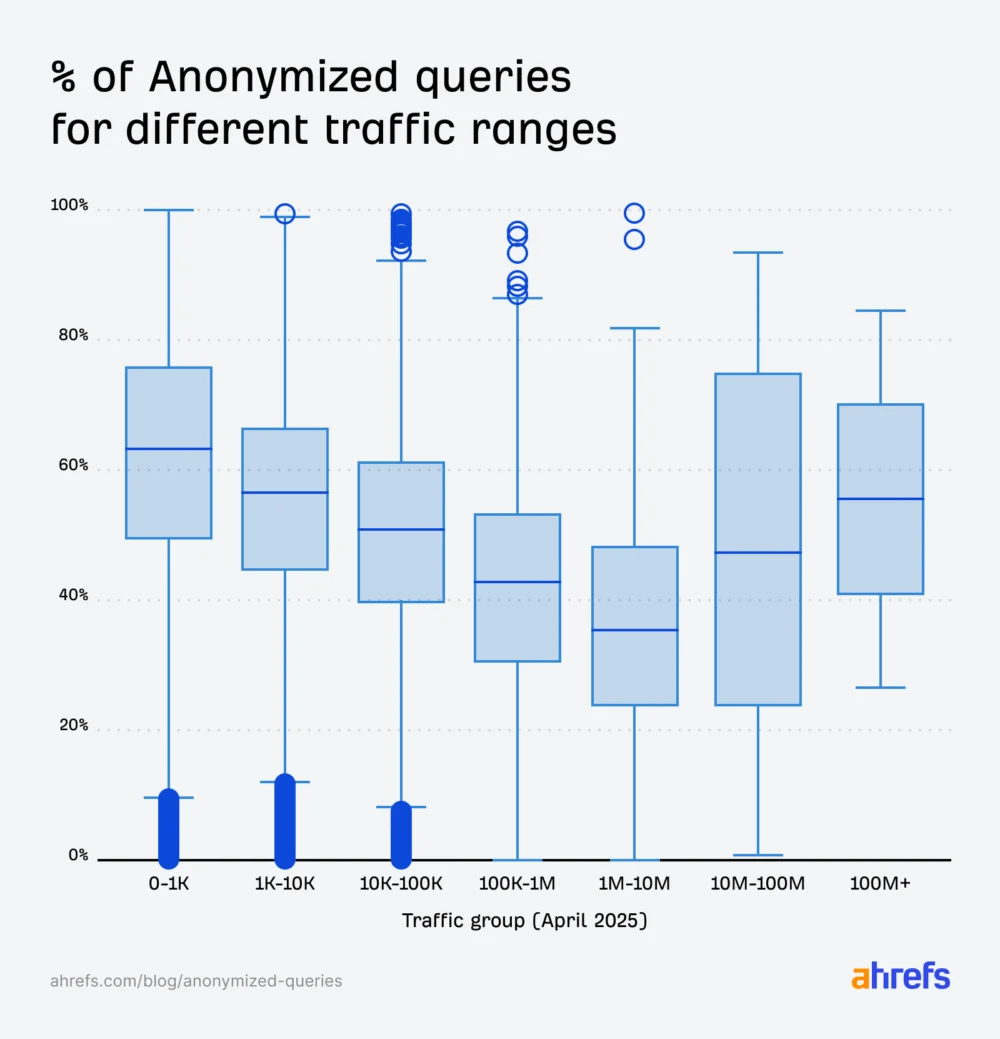
In April 2025, a staggering 46.77% of website traffic originated from anonymized queries, a pre-launch figure for Google’s AI Overviews. This represents a concerning increase from previous studies, with experts predicting this trend will accelerate due to evolving search behaviors and Google’s definition of anonymized data. This surge in anonymized queries means website owners are losing visibility into a significant portion of the searches that drive traffic to their sites, potentially impacting their understanding of user intent and content performance.
Understanding Anonymized Queries: A Broad Definition
The core of the issue lies in Google’s broad definition of anonymized queries. According to Google’s own documentation, anonymized queries are those "not issued by more than a few dozen users over a two-to-three month period." This classification is intended to protect user privacy. However, critics argue that this threshold is too low, effectively obscuring a vast number of less common, or "longtail," search terms.
A comparison with Google’s obligations under the EU’s Digital Markets Act (DMA) further highlights this discrepancy. For DMA purposes, Google defines anonymous queries as those not searched by more than 30 separate signed-in users in the last 13 months. Even this more lenient definition was estimated by DuckDuckGo’s CEO to omit approximately 99% of longtail queries. The definition used by Google Search Console for reporting website traffic is even more restrictive, suggesting that over 99% of longtail queries could be excluded from website owners’ data.
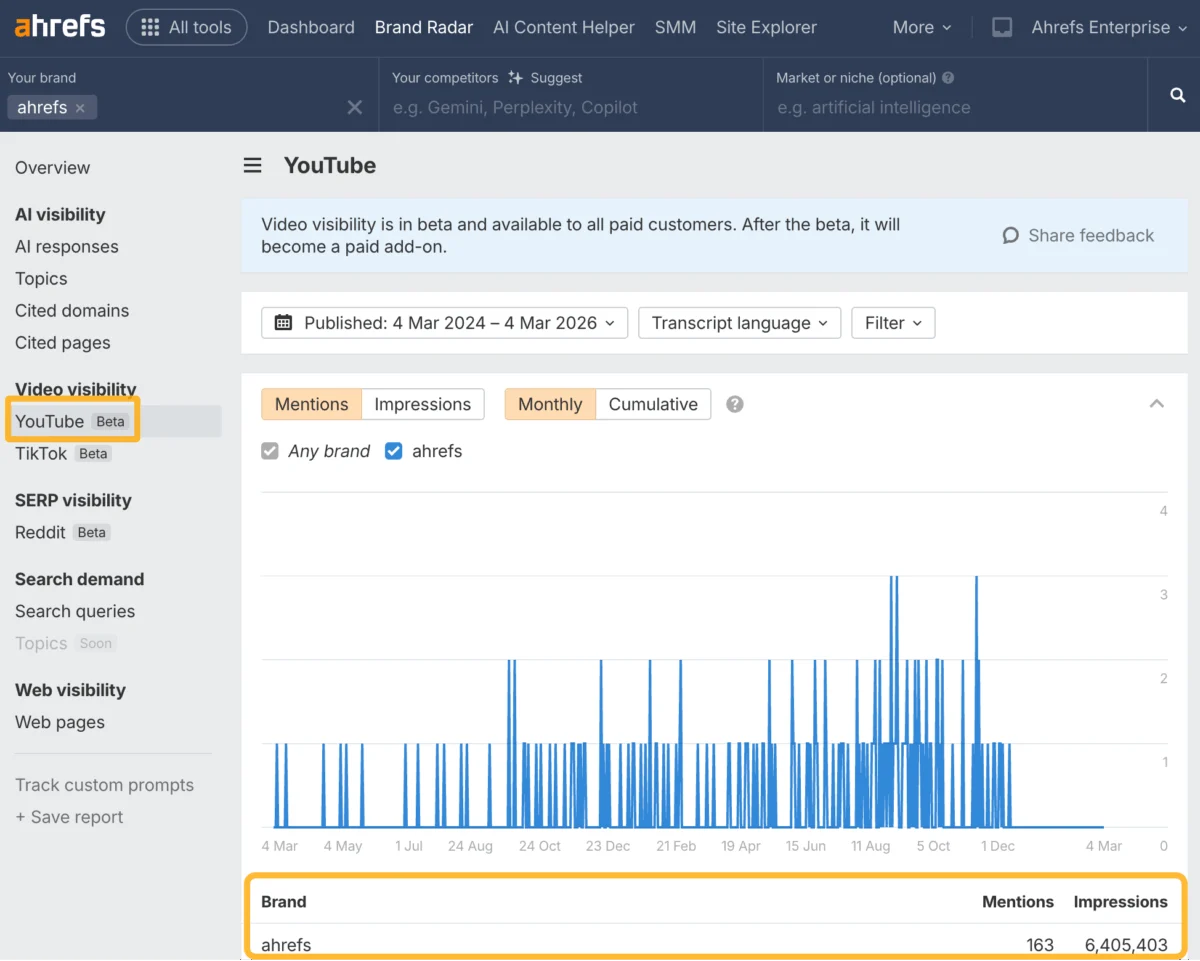
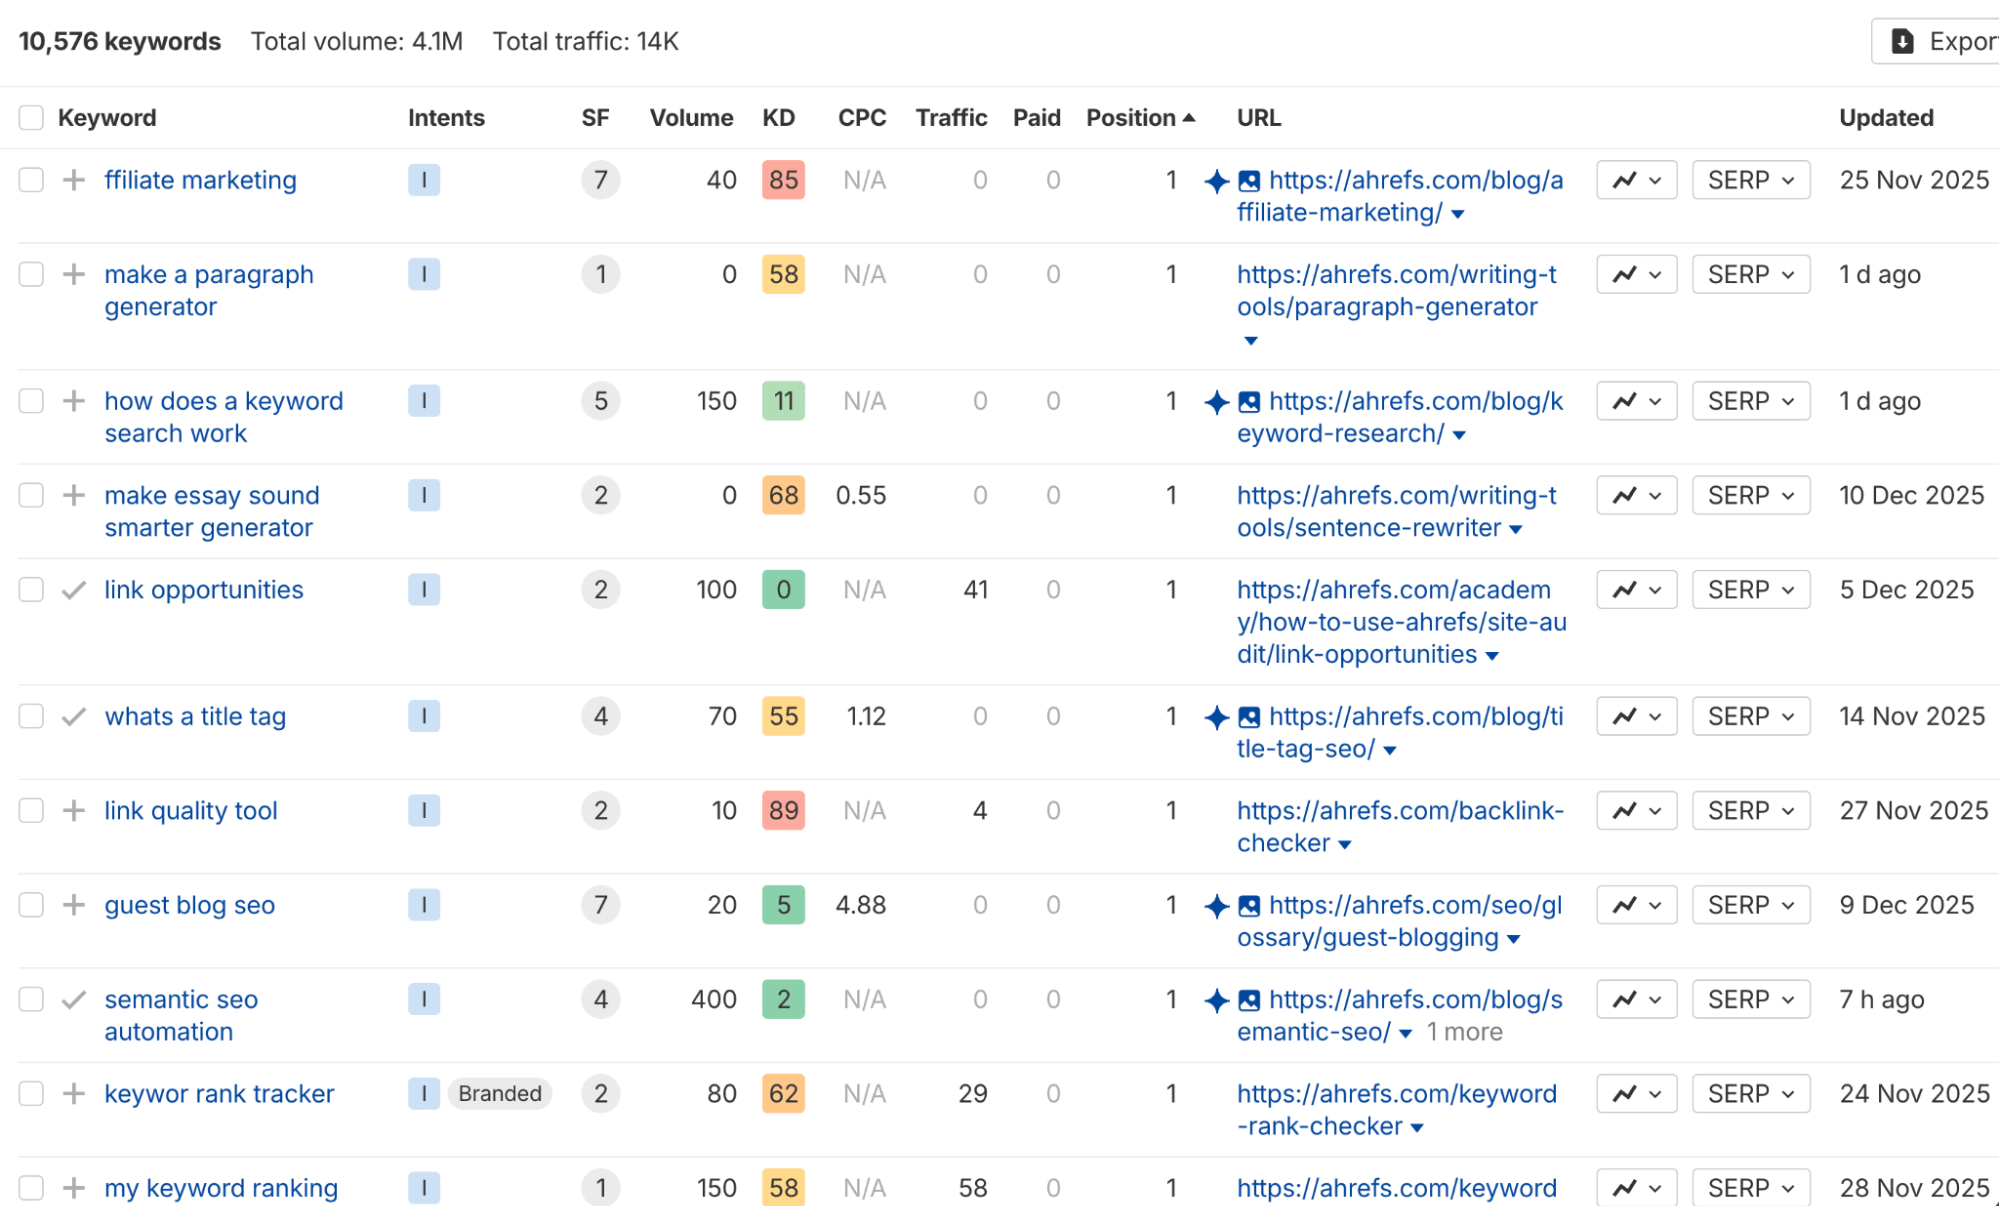
To help bridge this data gap, Ahrefs has developed an "Anonymous Queries report." This tool cross-references Google Search Console data with Ahrefs’ own data to identify terms for which a website ranks but which are not reported in Google Search Console.
The Escalating Trend: Pre-AI Overviews Data Reveals Alarming Trajectory
Data compiled by Ahrefs for April 2025, before the widespread rollout of AI Overviews and AI Mode, revealed that 46.77% of queries were anonymized. This figure is only slightly higher than the 46.08% observed in their 2022 study, which analyzed 9 billion clicks across 146,741 Google Search Console (GSC) properties. The most recent analysis expanded to an impressive 22 billion clicks across 887,534 GSC properties, underscoring the scale of the data examined.
This consistent and high percentage of anonymized queries is exacerbated by a significant shift in user search behavior: queries are becoming longer. Google has removed the previous 32-word limit on search queries, now only stopping when the URL character limit is reached, which can be as high as 2,083 characters or more. As search queries grow in length, they become less likely to meet the "few dozen users" threshold within Google’s anonymization criteria. This dynamic strongly suggests that the percentage of anonymized queries is poised to increase dramatically.
Data Distribution and Traffic Impact
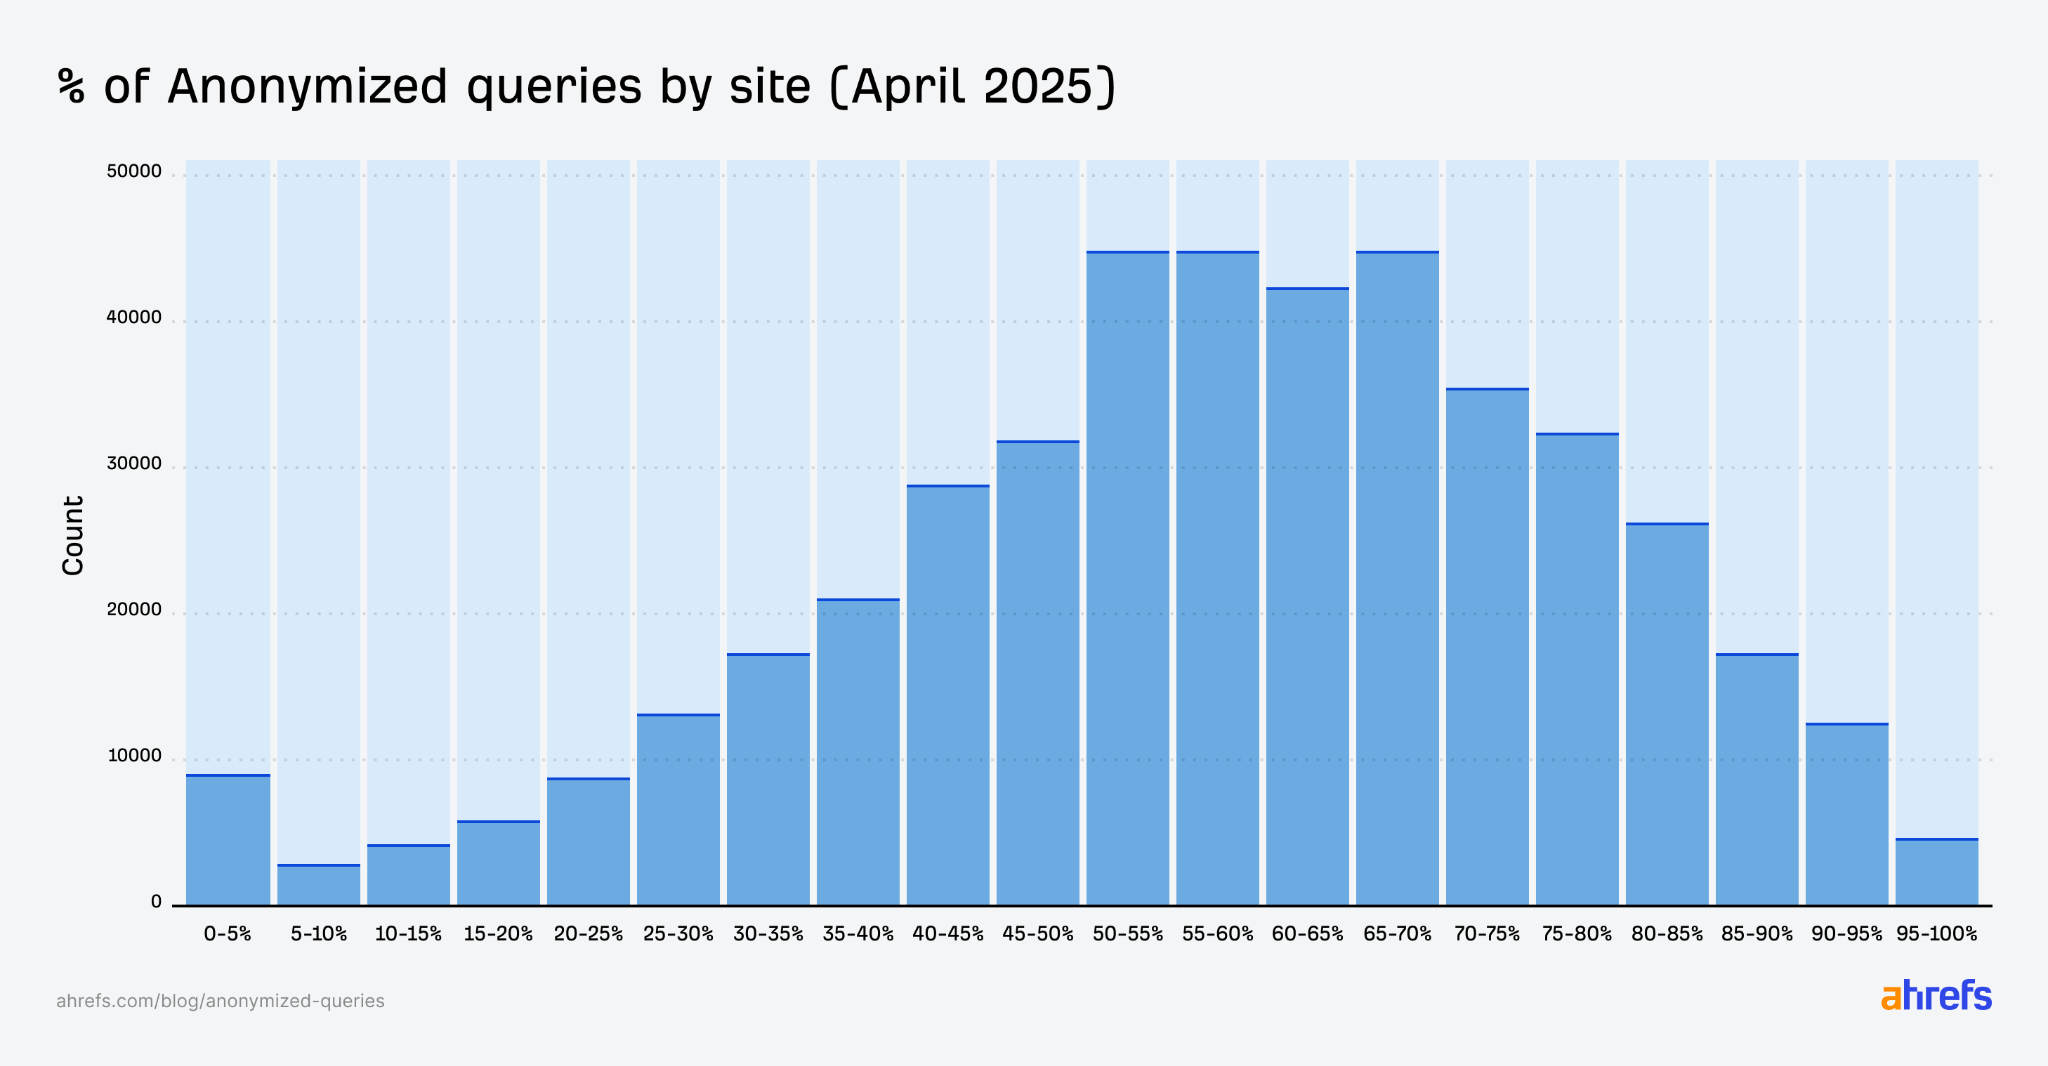
An in-depth analysis of the anonymized query data reveals interesting patterns. While the average percentage of anonymized queries stands at 46.77%, a histogram of this data shows that the most frequent percentage of anonymized queries for individual sites falls between 45% and 80%. This indicates that a substantial number of websites are experiencing a greater loss of data than the average might suggest.
Furthermore, the data reveals a correlation between website traffic volume and the percentage of anonymized queries. Websites with average traffic levels appear to retain more data compared to those with lower or higher traffic. This phenomenon suggests that sites with very low traffic may have a higher proportion of unique, niche queries that are more susceptible to anonymization. Conversely, high-traffic sites, which might be expected to have broader appeal and thus more common search terms, are also showing higher rates of anonymized queries. This could be attributed to the increasing complexity and specificity of searches even on popular topics, or the presence of proprietary or niche terms within their audience.
Understanding Box Plots in Data Analysis
To interpret the data presented regarding traffic ranges, a basic understanding of box plots is beneficial. A box plot, also known as a box-and-whisker plot, visually represents the distribution of numerical data through their quartiles. The box itself encompasses the interquartile range (IQR), representing the middle 50% of the data. The line within the box denotes the median (or second quartile). The "whiskers" extend from the box to the minimum and maximum values within a certain range, typically 1.5 times the IQR, to indicate the spread of the data. Outliers, data points that fall outside this range, are often plotted as individual points. In the context of the Ahrefs study, these box plots illustrate the range, median, and spread of anonymized query percentages for websites categorized by their traffic levels.
Future Implications and Continued Research
The confluence of evolving search behavior, particularly the trend towards longer queries, and Google’s anonymization policies points towards a future where website owners will have significantly less insight into the search terms that lead users to their sites. The anticipation is that this trend will continue to worsen with the further integration of AI into search results. Ahrefs plans to release further data to quantify this anticipated increase in anonymized queries as AI Overviews and AI Mode become more prevalent, promising to keep stakeholders informed about the ongoing changes in search data visibility.